755 подписчиков
99 видео
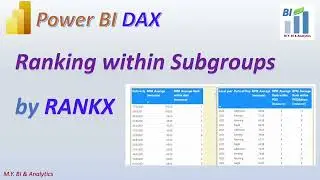
Power BI DAX: Data Values Ranking within Subgroup with RANKX
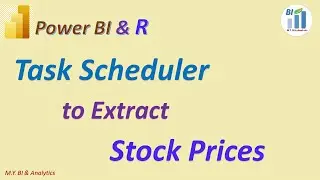
Power BI & R: Get Daily Stock Prices Automatically with Windows Task Scheduler,
#shorts
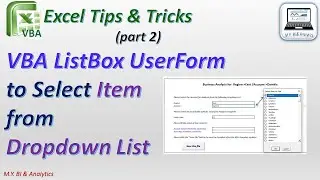
Excel VBA (part 2): UserForm to Select Item from Dropdown List
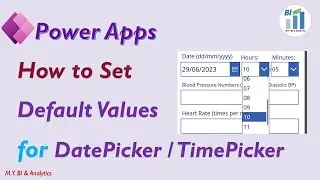
Power Apps Tips: How to set the Default Values for the DatePicker Control and TimePicker Control
Excel Dynamic Arrays Tips: Cumulative Sums by SUBTOTAL with OFFSET & SEQUENCE
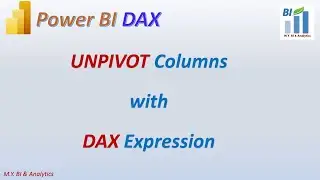
Power BI DAX: UNPIVOT Columns with DAX Expression
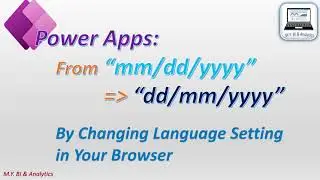
Power Apps Tips & Tricks: Date format from "mm/dd/yyyy" to "dd/mm/yyyy" by browser language settings
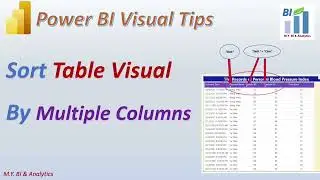
Power BI Visual Tips: Sort Table Visual by Multiple Columns
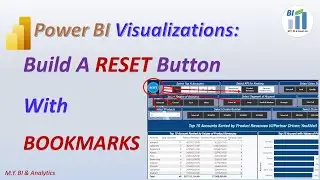
Power BI Visualizations: Build Reset Button with Power BI Bookmarks in a Multi-Slicers Report Page
Power BI Power Query Tips: Age Calculations with Power Query DATE and DATETIME Functions
Power BI DAX: Dynamic Age Calculation with DATEDIFF and FORMAT
Power BI Animation: Singapore's population change from 1960 to 2020
Power BI Modelling Tips: Organize Your Measures with Power BI Measure Group
Excel VBA: A Macro to Generate Yearly Loan Schedule Report with Aggregated Monthly Re-Payments
Power BI DAX: A Joint Measure to concatenate different measures with ampersand (&) Operator
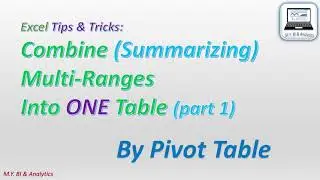
Excel Pivot Table Wizard : Consolidate Multi-Ranges into One Table
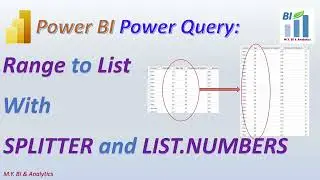
Power BI Power Query: Range to List for Dimension Table with Functions SPLITTER and LIST.NUMBERS
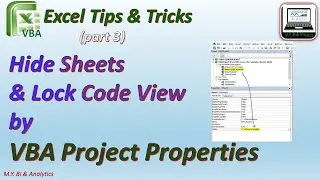
Excel VBA (part3): Hide Sheets & Lock Code View by using VBA Project Properties
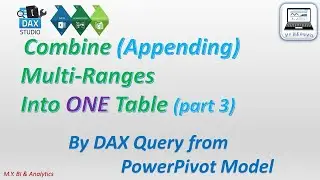
DAX Studio & Excel Power Pivot: DAX Query combines Multi-Ranges from Power Pivot Data Model
Power BI Power Query & R: Calculate MACD Indicators with Assumed Initial Values,
Power BI AI Visualizations: Decomposition Tree AI Splits with Absolute Mode and Relative Mode
Excel VBA: A Macro to Generate Line Chart Dynamically for Loan Schedule Trend Report.
Power BI Advanced Visualizations: Circular BarPlot with R Script Visual
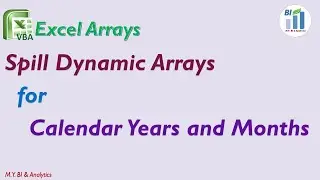
Excel Dynamic Arrays: Spill Dynamic Arrays for Calendar Years and Months (Date List)
Power BI with R: How to Get Power BI ready for R script
Power BI Advanced Visual & R: Simulate 3D Quadratic Surface in R Script Visual,
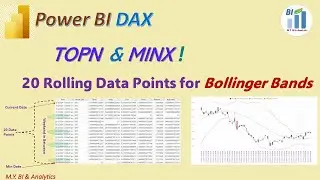
Power BI DAX: DAX MINX & TOPN find Dynamic Rolling 20 Data Points for Bollinger Band Calculations
Power BI Q&A Visual: Use Q&A visual to quickly get answers from data
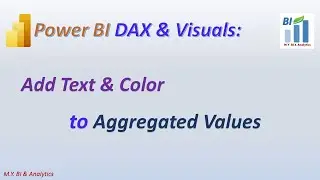
Power BI DAX: Add Status Labels and Colours to Visual’s Value and Title with calculated Measures
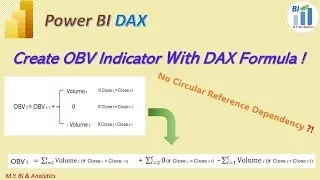
Power BI DAX Tips: Calculate OBV Indicator with DAX based on a mathematical formula transformation
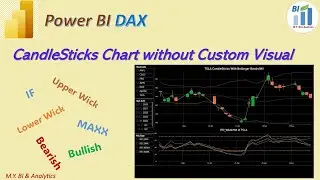
Power BI DAX Tips: DAX Measures for CandleStick Chart via Line & Stacked Column Visual
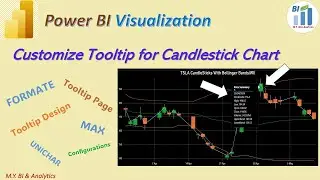
Power BI DAX tips: Customize Tooltip for a Candlestick Chart,
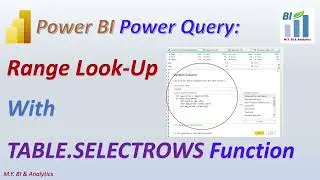
Power BI Power Query Tips: Range Lookup with Power Query M Table Function TABLE.SELECTROWS
Power BI unzip: import and unzip the files from OneDrive
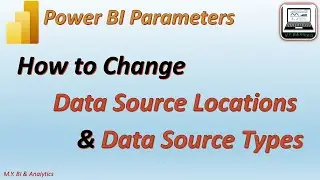
Power BI Parameters: Switch Data Source Locations and Types for the queried source tables in Desktop
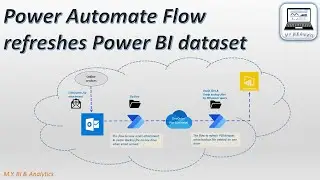
Automate Cloud Flow: Refresh Power BI when file created at OneDrive
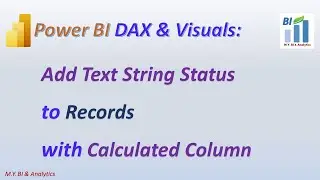
Power BI DAX: Add String Status Labels to Records with Calculated Column
Power Apps Tips & Tricks: how to convert existing free text input field to dropdown list input field
Power BI Tips & Tricks: Object Level Security for Columns and Tables
Excel Tips & Tricks: Dropdown List by Indirect Function with Range
Excel Tips & Tricks: Dynamic Ranges with Comparing INDIRECT, INDEX, and OFFSET for Data Retrieval
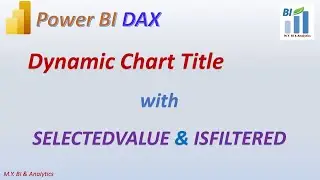
Power BI DAX: Dynamic Title with SELECTEDVALUE and ISFILTERED
Power apps tips & tricks: change date format view from mm/dd/yyyy to dd/mm/yyyy by text functions
Power BI DAX: Rank Top N Accounts with calculated measure for visual filter based on user selections
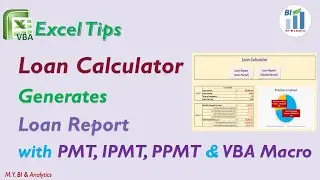
Excel Tips & Tricks: A Loan Calculator with PMT, IPMT, PPMT & VBA Macro for Loan Report
Power BI AI Visualizations: Predict Future Values for Time Series Data with Line Chart forecasting
# shorts: Power BI Tips: Custom Sorting to Power BI Visuals with Power Query
Power BI & PowerPoint Integrations: Embed Live Power BI report page in PowerPoint
.webp)