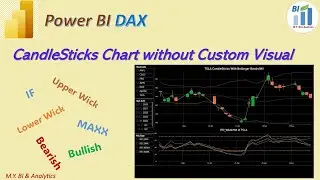
Power BI DAX Tips: DAX Measures for CandleStick Chart via Line & Stacked Column Visual
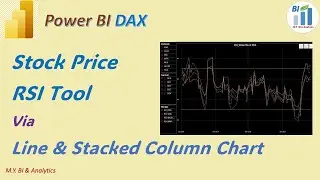
In last video I have created the RSI chart for Stock Price Movement analysis and also mentioned that we need to combine the RSI tool with other technical analytic tool, such as Candlestick tool to reach more accurate analysed result. Of course, we can easy to draw the Candlestick chart by PBI custom visual and present it with the RSI chart in a sample report page. But such combined charts in same page sometimes you may find an issue to sync the two charts by the date base at X axis.
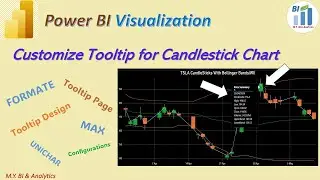
In this video I have shared an approach to create necessary DAX measures to build Candlestick chart wihtout Custom visual but via power BI standard line & Stacked Column visual by which we have created RSI chart in last video.
References :
Mike Guangyuan YU - The Popular Technical Analysis Tools for Stock Price Movements Analysis (google.com) :
https://sites.google.com/view/mikegua...


![ENHYPEN (엔하이픈) – Royalty [Color Coded Lyrics Han/Rom/Ina ]](https://images.videosashka.com/watch/SnkFfyXUktc)