Power BI Transform Data with R: Calculated Columns for 4 types of Relative Strength Index (RSI)
RSI or Relative Strength Index developed by Welles Wilder in 1978 is a popular tool used in technical analysis to identify potential overbought or oversold conditions in a stock's price movement. It is a “momentum indicator” that considers daily stock gains and losses during a specific trading period, providing a value between 0 and 100, with the equilibrium level at 50. It helps to determine whether a stock is more likely to continue its current trend or change direction. Thus it attracts many analysts to create RSI visual chart in different ways to support decision making demands.
Regarding the concept, interpretation, calculation and types of RSI I have explanations in detail at my BI Analytics Website, I have placed it’s URL link in this video descriptions for your references.
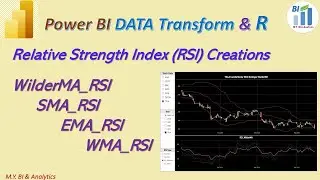
In the website I have described 4 types of RSI based on it’s moving average calculations. They are list as WilderMA RSI ,SMA RSI, EMA RSI, and WMA ESI.
The WilderMA RSI is the Wilder's moving average RSI, a default RSI calculation in all RSI applications, which Offers a balance between responsiveness to recent price changes and smoothing out noise for a more stable RSI. In the website I have explained how this RSI type has been calculated.
The SMA RSI is based on Simple Moving Average (SMA), it smooths price data evenly over a specified period, can be less responsive to recent changes compared to WilderMA RSI, and potentially leading to slower identification of trends.
The EMA RSI employees the Exponential Moving Average (EMA) which places more weight on recent prices. making it more reactive to market movements but potentially more prone to false signals.
The WMA RSI, apply Weighted Moving Average (WMA) which allows customization of weight distribution assigns weights to past prices with more emphasis on recent ones, offering a level of responsiveness between Wilder RSI and EMA RSI.
In this video, I have shared a way in Power BI desktop on how to calculate the 4 types of RSI through Power BI data transform by R script. Later in coming videos I shall share a way on how to create a stock price RSI analysis charts by which we can compare the different types of the indicator.
References:
https://sites.google.com/view/mikegua...


