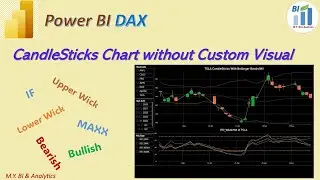
Power BI DAX: Dynamic Title with SELECTEDVALUE and ISFILTERED
With dynamic titles in power BI visualization charts, report users can easy follow the changes of the filtered data values when different slicer values are clicked and selected.
For example in my demo power BI desktop file I have two clustered bar charts which are counting the sales opportunity numbers by the dimensions sales stage and sales size for related regions. In left hand side I have created two slicers for the product category list and the partner category list which both are used to filter opportunity numbers with their existing other dimensions for deep dive checking and analysis.
When we click on the product tick-box “Abbas” from product slicer we see the changes of the data values in both charts and same time we found that charts titles in both chart are also automatically updated. I.e. the product is updated as “Abbas” from “No Value Selected”, again when we click on the partner “ Direct” from partner slicer we see changes on titles and data values in both charts.
To enable the dynamic title we need to create a measure by DAX function SELECTEDVALUE and ISFILTERED. The SELECTEDVALUE is a filter function . It returns a value when the context for columnName has been filtered down to one distinct value only. Otherwise returns alternateResult. The ISFILTERED is an information function. It returns TRUE when the specified table or column is being filtered directly. We use ISFILTERED function to enrich and format the alternateResult of the function SELECTEDVALUE in our case. I have attached the URLs of the two functions definitions and descriptions in the video description for your references.
Now let’s see how does my created measure for dynamic title looks like.
Name the measure as “Dynamic Title for Opp count”
Define the variable for Selected Product as equal to function SELECTEDVALUE, the filtered column should be the Product code of Table Product. Otherwise in the case “no one distinct value” return , we apply IF function to check return value of ISFILTERED function to the product code column based on clicked or not, if return TURE on filtered, then must be the “Multiple Value Selected” for the scenario, otherwise user does not select any value from target column Product code. We assign the scenario as “No Value Selected”.
Same way we define the variable for selected Partner as equal to function SELECTEDVALUE, filtered column should be “Partner” of table “partner”, alternatively apply IF function to check return value from ISFILTERED function to the filtered column partner, if returns TURE then assign value “Multiple Value Selected”, returns FALSE then assign value “No Value Selected”.
Finally we return value to the Measure as: Open Double Quotes, text Product, colons and space , close double quotes, ampersand, variable Selected product, ampersand, open double quotes, space, slash, space, text Partner, colons, space, close double quotes, ampersand, variable Selected partner,
Check and ensure the dynamic title measure is ready to apply.
Click top bar chart, on right hand side expand visualizations panel, choose icon ”format your Visual”, Choose General tab, switch on and expand the arrow “Title”, under Text menue click the icon “Conditional formatting”. In popup Box, under box” what field should we base this on”, choose the measure “Dynamic Title for Opp count” from the Table for hosting measures”, click OK. Then we see a title in the chart.
Repeat the steps to place the dynamic title measure into the bottom bar chart.
Test the dynamic title by choosing product “Abbas”, then choose partner “Direct”, then “Ctr” plus click to choose the combination partner “is-technology” with “Direct” together, we see the changes to the data value and title value automatically and correctly.
Thanks for your watching, if you like to watch more videos from my channel please press subscribe button. See you in next video
References:
SELECTEDVALUE function - DAX | Microsoft Docs
https://docs.microsoft.com/en-us/dax/...
ISFILTERED function (DAX) - DAX | Microsoft Docs
https://docs.microsoft.com/en-us/dax/...
For more info of my BI & Analytics, please refer to the following website links:
My BI & Analytics Website:
https://sites.google.com/view/mikegua...
My blog website :
https://mikeyubianalytics.blogspot.com/

![[FREE] SLIMESITO x BEEZYB TYPE BEAT 2022 -](https://images.videosashka.com/watch/1EoTITwenvE)