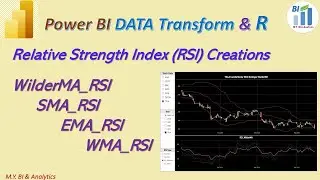
Power BI DAX: DAX MINX & TOPN find Dynamic Rolling 20 Data Points for Bollinger Band Calculations
There are many approaches to creating Bollinger Bands in Power BI. we can leverage the built-in Run R script functionality or create custom functions within Power Query Editor to generate the three bands. Alternatively, we can use custom DAX formulas. Even with the DAX formula approach, we have two options, the reason is that calculations of SMA and StdDev require time window size, the default is 20 days. These requirements indicate that we will only get more accurate calculations for the two indicators after having 20 data points. Thus, first trick is how to handle the early missed 20 data points for calculating first 20 SMAs and StdDves. This how to methods lead two approaches, either to assume initial values for the first 20 data point or just to wait until having enough rolling 20 data points.
Another trick is the time window size itself. The 20 days should represent trading days, excluding weekends and holidays. Thus for the calculation on how to find out the valid rolling 20 date range with a identified dynamic maximum date and a minimum date from the stock price table is crucial
In this video I have shared an approach on how to use DAX formula to create the three Bollinger bands without initial value assumption by using DAX function TOPN, MINX and COUNTROWS etc. Hope you enjoy the Video demo.
References:
Mike Guangyuan YU - The Popular Technical Analysis Tools for Stock Price Movements Analysis (google.com) :
https://sites.google.com/view/mikegua...


