Microsoft Excel Functions & Features for Accountants Financial Reporting
#excelforfinance #formulas #excelfeatures #finance
In this class, we shall learn about 8 features and functions used by Finance professionals specifically accountants while they generate financial reports using Microsoft Excel in other words, the key Excel functions and features that accountants should know.
We shall review a use case for Financial Reporting Practically during our Live Class on the 1st March 2024. Please don't miss it!
If you want to join our WhatsApp community to enjoy such free weekly Excel Classes then click on this link: https://chat.whatsapp.com/HkW7HFBy7Pw...
To grab the file used during the live class so that you can follow along please click this link below:
https://docs.google.com/spreadsheets/...
00:00 Why do Accountants need Excel?
01:50 What do Accountants use Excel for?
04:00 How to use the SUM function as an Accountant. This is used to add up values together in Excel and produce an aggregate value. In the financial reporting situation, this function can be used to subtotal each section and subsection of our financial statements.
05:17 How to use the MAX function in Excel as an accountant. This function is generally used to find the largest number in a range of cells and in the financial reporting situation, this can be used for example to find the year-end date based on the date column in the General Ledger.
05:56 How to use SUMIF or SUMIFS functions in Excel as an accountant. These two functions can be used to add up numbers based on a condition and while accountants use these functions, they can be used to pull through totals for each line item in our Trial Balance and financial statement in any financial reporting situation.
06:23 How to use the VLOOKUP function in Excel as an accountant. This is a lookup and reference function that is used to Look up a specified value in the leftmost column of a specified table and returns the value in the same row from a specified column in the table. In the accounting or financial reporting situation, we can use this function to map our Chart of Accounts with financial Statements and the General Ledger.
07:04 How to use the IFERROR function in Excel. This function can be used to clean up any error messages that we do not want to be displayed in our Excel Financial Reports. Sometimes when such errors are left in the reports they will look ugly.
07:36 How to use PIVOT TABLES in Excel for financial reporting. We can use this feature to Extract a Trial Balance and notes to the accounts while we perform financial reporting using Microsoft Excel and in this class, we shall see practically how to do this in a financial reporting situation using Excel.
08:50 How to use Conditional Formatting in Excel as an accountant. We can use this feature in our financial reports to highlight favorable and adverse variances in our financial reports.
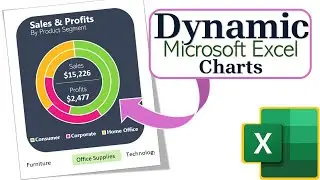
09:55 How to use the PIVOT CHARTS during financial reporting work. We can use this feature to plot monthly revenue on a graph during any financial reporting situation.
11:14 Understanding the General Ledger
11:19 How to Prepare Financial Statements in Excel?
11:23 How to do Mapping of Chart of Accounts with the General Ledger
11:43 How to do Ageing Analysis in Excel using Pivot Tables.
11:46 How to Extract Notes to the Accounts in Excel.
11:58 How to perform variance analysis in Excel.
13:48 Understanding the General Ledger Extract from Quickbooks Accounting software.
Let's connect on Other Social Media
TikTok: https://vm.tiktok.com/ZMFcXgkJY
Thank you for watching! If you would like to contact me for training your team. My WhatsApp number: is +256 773 523 826 Email Address: is [email protected]
Transcript


![Introduction to Power BI DAX formulas for Complete Beginners [Live Online Class]](https://images.videosashka.com/watch/dYuVq0pR4Hs)