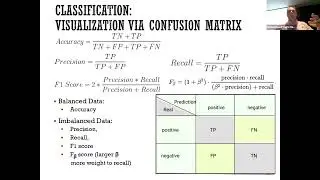
Lesson 12: Principles of Data Science by Mohammad Hajiaghayi: Information Visualization
In this session, we are delving into individual information visualizations. We previously covered the data science process, which involves obtaining, cleaning, and understanding data, and now we aim to present this data effectively to others. We touched upon Matplotlib and mentioned a deeper dive into visualizations, which we are covering now. Visualization, an ancient technique dating back to early human history, is crucial for communicating data insights effectively and efficiently.
The importance of information visualization lies in its ability to convey complex data insights with clarity and precision. Historical examples include hieroglyphs, cave paintings, and early maps, evolving into modern computer-based visualizations. Notable figures in this field include William Playfair and Charles Joseph Minard, who pioneered graphical methods for statistics. The evolution continued with the integration of infographics in media and the rise of visual analytics on social networks, enhancing how we communicate data today.
Modern information visualization employs tools like D3.js and ReactJS to create interactive, reusable components for web applications. These tools allow for the creation of sophisticated visualizations that can be easily updated and maintained. ReactJS, in particular, stands out for its component-based structure, making it ideal for developing complex, scalable visualizations. By using these state-of-the-art tools, we can ensure our visualizations are both informative and adaptable to changing data and needs.
#DataScience, #ConfusionMatrix, #Precision, #Recall, #Accuracy, #f1score, #Visualization, #Matplotlib, #InformationVisualization, #HistoricalExamples, #WilliamPlayfair, #CharlesMinard, #D3js, #ReactJS, #InteractiveVisualizations