Power BI DAX: Retrieve Extremums (Max/Min) Across Multiple Columns
In this video I want to show you on how to find Extrema (Max/Min) Values for Combined Associated Indicators based on Multiple Columns with data modelling and DAX expressions.
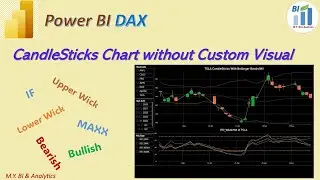
In my example desktop file, we have a matrix visual to describe the maximum, minimum, and average values of systolic indicator, Diastolic indicator and Pulse indicator according to slicer selections of the report page. To the maximum and minimum values of indicators, for example, the maximum of systolic , when we list the systolic max value same time we need also to append it’s associated max Diastolic value as well. For this need, our calculations should first find out a max value of systolic, then based on this max systolic to check out it’s associated max Diastolic.
To find out these extremums we may have different approaches which depends on what data we already have in our existing data model schema. From our sample file in data model view, we see that in the Fact table “Blood Pressure list” we have those records of systolic, Diastolic and Pulse with each records id in different columns and stored in a crosstab table structure. As our designed matrix visual requires blood pressure indicator category in row to describe the three measures of maximum, minimum and average in columns. Thus to easy measure calculations we may first to change these data store structure from the crosstab structure to a tabular structure. Which means : unpivot those relevant value columns by record id column, and then link the unpivoted new tabular table via the record id back to the Fact table to align with other rest info, such as date, name and age etc. which are in existing reporting slicers.
With the created ready tabular table structure we can easy to apply DAX expression to create the measures to retrieve the max, min , average values according to the attribute category column.
In this video, the method for creating Unpivot tables by power query is demonstrated , and also the DAX expersion for unpivoting table is also mentioned. Finally the measures created with DAX experssion to retrive extrema values of Indicator and it's associated indicator is demonstrated and explain. The Baisc ides is to find maximum of perimary indicator , the serach it's associated coressponding indicator list and determine the max value. In the video demo. the DAX functions MAX, MAXX, AVERAGE, SELECTCOLUMNS , CALCULATETABLE, SWITCH and FIXED are applied.
References:
MAX function (DAX) - DAX | Microsoft Learn
https://learn.microsoft.com/en-us/dax...
MAXX function (DAX) - DAX | Microsoft Learn
https://learn.microsoft.com/en-us/dax...
SELECTCOLUMNS function (DAX) - DAX | Microsoft Learn
https://learn.microsoft.com/en-us/dax...
CALCULATETABLE function (DAX) - DAX | Microsoft Learn
https://learn.microsoft.com/en-us/dax...
SWITCH function (DAX) - DAX | Microsoft Learn
https://learn.microsoft.com/en-us/dax...
FIXED function (DAX) - DAX | Microsoft Learn
https://learn.microsoft.com/en-us/dax...
AVERAGE function (DAX) - DAX | Microsoft Learn
https://learn.microsoft.com/en-us/dax...
For more info of my BI & Analytics, please refer to the following website links:
My BI & Analytics Website:
https://sites.google.com/view/mikegua...
My blog website :
https://mikeyu.lovestoblog.com/