Free Max Device: Multi Spectrum Analyzer from Isotonik Studios
Download Links
http://www.joshuacasper.com/max-4-liv...
This free Max for Live device by the good people at Isotonik Studios allows you to see up to 4 spectrum analysis lines from 4 channels at the same time. Exclusive for Ableton Live 10!!
This Max for Live device is the first from Mark Towers to use the new functionality within Ableton Live 10. Drop it on an audio track and select the track s you wish to monitor and you’ll see each audio signal represented as a colour coded line on the LCD display.
Features Include
Compare up to 4 Tracks Simultaneously
Logarithmic or Linear Analysis
Freeze Spectrums
Spectrum Smoothing
Frame Rate Control
Line Thickness Control
Download the Device
Watch the Video
Full Release Notes
Multi Analyser is a simple frequency analysis device that allows up to 4 tracks to be viewed and measured in a single device. This can be particularly useful when mixing as it will allow for problematic/clashing frequencies to be visually identified and compared to each other.
Live 10 EXCLUSIVE!
Multi Analyser makes use of a new feature of Live 10 whereby Max for Live devices now support multiple audio inputs and outputs. Inputs and outputs can be accessed via the track’s input and output channel choosers. Devices can also be routed to arbitrary tracks via the Live API.
This means that as well as hard routing a tracks output to a Max for Live device or routing content of a Max for Live device out to dedicated track input, we can also grab the output of a track and send it into in Max for Live Device without disrupting its current signal flow (i.e. to Master). This is great for analysis and measurement tools but also it allows Max for Live devices to have side-chaining functionality, which was previously not possible.
System Requirements
Multi Analyser requires Ableton Live 10 and a version of Max for Live will also be needed either with Ableton Live 10 Suite or Ableton Live 10 Standard with the Max for Live extension. Multi Analyser will not work in Live 9.
How does it work?
When Multi Analyser is placed on a track with an audio output, it will automatically use that tracks audio signal as the ‘current track’ frequency visualisation. All tracks are monitored post-mixer.
If the device is moved or copied to another track, it will update the current track menu. If this does not happen immediately, simply click the ‘R’ button to the right of the menu to reset.
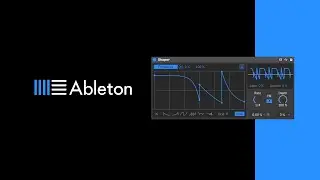
The current track is represented by the pink line on the frequency graph:
Compare Using the menus, up to 3 more tracks from the current Live set are selectable and will be represented on the graph as yellow, green and blue lines respectively. Any of the four tracks can be bypassed using the coloured buttons to the left of the menus, A, representing the current track, B, C and D representing the comparison tracks.
The graph to the right of the device displays the frequency spectrum of the selected tracks in real-time. The X axis represents frequency measured in hertz and the y-axis represents amplitude measured in decibels.
At the bottom of the graph are some additional options for customisation:
Freeze pauses the display.
Line Controls the thickness of the lines on the graph.
Smooth applies a sliding function to the lines creating smoother, more gradual movements instead of faster peaks.
Frames determines the frames per second for display updates when visualizing an audio signal.
Log/Lin switches the frequency elements of the graph between logarithmic and linear analysis.
------------------------------------------------------------------------------
Joshua Casper Online:
http://www.joshuacasper.com
/ djjoshuacasper
/ joshuacasper
/ joshuacasper