DataWarrior: Advanced data visualisation and macros
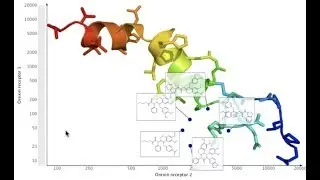
Webinar from AMG Global Compound Design series (September 2018) presented by Isabelle Giraud (Idorsia) who returned to demonstrate how to use the macro functions of DataWarrior - the popular free tool for scientists involved in drug discovery. She showed how DataWarrior can be used to create animated views of data acquired at different time points and produce new ways to present your structure-activity relationships. Inbuilt functions such as the ability to reverse pivot data simply and efficiently were also demonstrated. You can add life to your presentations by changing the background to emphasise particular aspects of the data.
Timeline
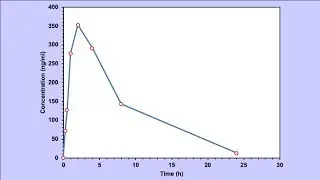
0:00 Animated views of timeline data
7:17 Creating a visualisation from scratch using malaria data from gapminder.com
9:00 Reverse pivoting data
10:50 Merging data from two files
16:00 Using markers for multidimensional data
19:00 Changing the plot background
20:42 Bringing SAR plots to life
26:00 Editing an image with inkpen open source editor
27:00 Macros to perform routine tasks or reuse complicated analyses
35:00 Edit an existing macro that runs a structure search for artemisisn on ChEMBL and plots activity data
40:00 Change the structure to chloroquine
43:00 Record a new macro
48:00 Q&A's
