AWS Data Visualization with Amazon QuickSight | Amazon Redshift Data Visualization in QuickSight
===================================================================
1. SUBSCRIBE FOR MORE LEARNING :
/ @cloudquicklabs
===================================================================
2. CLOUD QUICK LABS - CHANNEL MEMBERSHIP FOR MORE BENEFITS :
/ @cloudquicklabs
===================================================================
3. BUY ME A COFFEE AS A TOKEN OF APPRECIATION :
https://www.buymeacoffee.com/cloudqui...
===================================================================
Introduction
Overview of Amazon Redshift: Briefly explains what Amazon Redshift is—a fully managed data warehouse service that makes it easy to analyze large amounts of data.
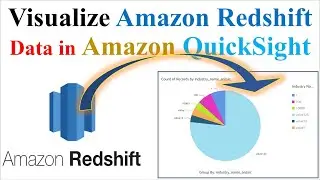
Overview of Amazon QuickSight: Introduces Amazon QuickSight as a scalable, business intelligence (BI) service that provides interactive visualizations and insights.
Prerequisites
AWS Account: Instructions on ensuring you have an AWS account with access to both Amazon Redshift and Amazon QuickSight.
Data Preparation: Overview of the type of data typically used and how it should be structured in Redshift.
Connecting Amazon Redshift to Amazon QuickSight
Setting Up Permissions:
Guide on configuring necessary IAM roles and permissions to allow QuickSight to access Redshift data.
Instructions on ensuring Redshift’s security group allows connections from QuickSight.
Adding Redshift as a Data Source in QuickSight:
Demonstrates how to navigate the QuickSight console to add Amazon Redshift as a data source.
Steps for entering connection details, including cluster endpoint, database name, and credentials.
Creating a Dataset:
Instructions on selecting tables or writing SQL queries to define the dataset within QuickSight.
Techniques for filtering and preparing data for analysis.
Visualizing Data
Creating Analyses:
Walkthrough of how to create a new analysis in QuickSight using the dataset from Redshift.
How to choose the right visualizations (e.g., bar charts, line graphs, pie charts) based on the data.
Building Dashboards:
Guide on combining multiple visualizations into a single interactive dashboard.
Tips on customizing the dashboard layout, adding filters, and configuring interactivity.
Advanced Features
Using QuickSight’s SPICE Engine: Explanation of how QuickSight's in-memory calculation engine (SPICE) can enhance performance and scalability.
Creating Calculated Fields: How to add custom calculations or aggregations directly in QuickSight.
Embedding Dashboards: Instructions on embedding QuickSight dashboards into other applications or websites if needed.
Troubleshooting
Common issues and their solutions, such as connectivity problems, data discrepancies, or permission errors.
Conclusion
Recap: Summary of the steps covered in the video.
Additional Resources: Suggestions for further reading or additional resources, like AWS documentation or related tutorials.
Repo Link : https://github.com/RekhuGopal/PythonH...
#aws #redshift #quicksight #datavisualization #howto