Virtual Lab: Temperature Over Time Involving Phase Changes
When energy enters a system and when phase changes are involved, the rate that temperature changes is not constant. Graphing the temperature over time demonstrates this.
LAB DIRECTIONS:
PROCEDURES
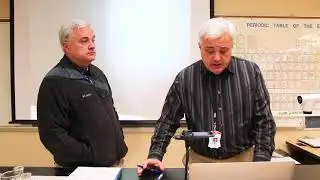
Follow the example in the video to set up your apparatus OR collect data from the video demonstration.
Begin with an abundance of ice; use enough water to cover and barely float the ice.
RESULTS
Record the temperature of the water/ice (eventually, just water) every minute until the water is boiling and the temperature does not increase for four minutes.
CONCLUSIONS
Graph the data noting the phase changes.
DISCUSSION
Explain the different rates of temperature change over the time period. Discuss, in particular, the effect of the phase changes on the rise in temperature.
More from the creator…
The World Around Us Blog:
http://billonscience.blogspot.com/p/b...
https://billonscience.blogspot.com/p/...
All Things Bill Snodgrass:
http://www.billsnodgrass.com
NOTICE:
The producer of this video offers it as-is to viewers who are free to use it at their own risk. Errors and omissions are not the responsibility of the producer, nor of anyone associated with its production.
The video and its contents are the sole responsibility and property of Bill Snodgrass. No other party or agency is involved.
Video shot at Lowell High School, Tricreek School Corporation, Lowell, Indiana. Lowell High School, Tricreek School Corporation, Lowell, Indiana and The State of Indiana are not responsible for the production or content of this video.


