How to Display Last Six Months Trends in Power BI Chart Using Slicer | Tutorial| #39
"How To Display Historical Trends in Power BI Using Slicer", "How To Showcase Trends Backward from Slicer in Power BI", "How To Visualize Last Six Months Trends in Power BI Chart", "How to do Last Six Months Trends Analysis with Slicer", " Showing Trends Backward from Slicer Selection"... all these questions have been answered in this video...
You may also like to watch -
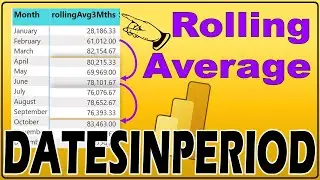
Rolling Average with DATESINPERIOD - • Calculating Rolling Average in Power ...
Same period last year - • Mastering DateTime in Power BI: SAMEP...
Calendar vs Auto Calendar - • Date Functions in Power BI with Examp...
Power BI Full Playlist - • Power BI
Data Transformation and Analysis with Pandas - • Python Pandas Tutorial for Beginners ...
Visualization in Python with Matplotlib - • Python Matplotlib Tutorial for Beginn...
Visualization in Python with Seaborn - • Seaborn Beginner to Pro | Seaborn Tut...
Data Science Playlist - • Data Science
Statistics Playlist - • Statistics
NLP Playlist Complete - • NLP - Natural Language Processing
Complete Python Tutorial for Beginners - • Python for Beginners to Pro | Python ...
Complete NumPy Tutorial for Beginners - • NumPy
For all the Power BI Files - https://github.com/LEARNEREA/Power_BI...
For all the Excel Files Used in Power BI Videos - https://github.com/LEARNEREA/Power_BI...
#GroupByinPowerBI #Powerbi #dataAnalysis #visualization #Learnerea