18 тысяч подписчиков
552 видео
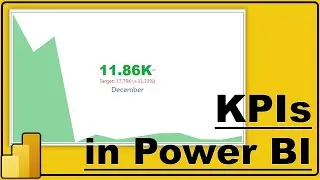
KPI in Power BI | How to create KPI visual in Power BI | #22
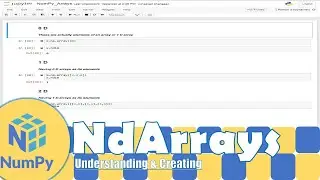
Python NumPy|Introduction to NumPy Arrays|Python for Beginners|Learnerea
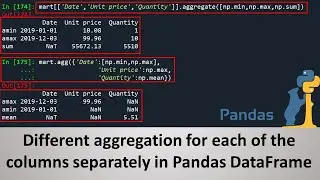
Aggregation in Pandas DataFrame in Python | Aggregating each of the variables separately
Maximizing Model Efficiency: Mastering Feature Selection Strategies in Data Science | Tutorial
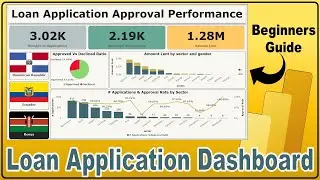
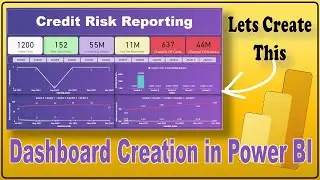
Dashboard Creation in Power BI: Loan Application Dashboard | #43
Categorical Features One-Hot Encoding, Scaling & Class Balancing | PD Model Dev - 2
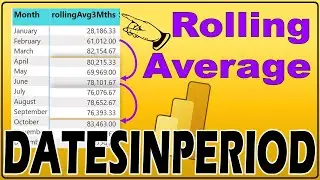
Calculating Rolling Average in Power BI using DATESINPERIOD! - Step-by-Step Guide| #25.24
SMOTE Mastery: Achieving Data Balance in Machine Learning | 3rd of Top 5 Data Balancing Techniques
Mastering Data Imbalance: 1st Out of Top 5 Techniques for Effective Balancing in Machine Learning
How to Display Last Six Months Trends in Power BI Chart Using Slicer | Tutorial| #39
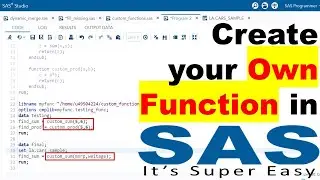
SAS Secrets Revealed: Mastering PROC FCMP for Custom Functions
Unlocking Insights: Analyzing Machine Learning Predictions in Power BI | Data Analytics Tutorial
Mastering Feature Selection: With Correlation Method | Part - 1
Model Monitoring Dashboard: Track KPIs, Confusion Matrix & Predictions | PD Model Dev - 5
Mastering Feature Selection: With Backward Elimination | Part - 5
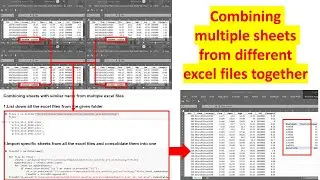
How to Combine Similar Sheets from Multiple Excel Files Together Using Python | Learnerea
Slicer in Power BI | Slicer for Text, Date and Numeric Columns | Hierarchical in Power BI| #6
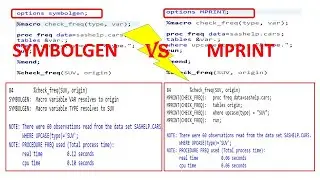
MACROS IN SAS - 6.3 | SAS Macro Debugging Option SYMBOLGEN | Debugging with SYMBOLGEN VS MPRINT
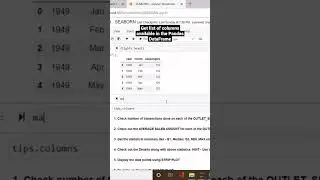
Get the list of Columns available in a data frame
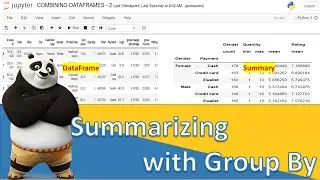
Python Pandas Group by Function/Method on DataFrames | Pandas Group by Basic to Pro
Logical Functions in Power BI with Examples| If then else, Nested If in Power BI| #25.15
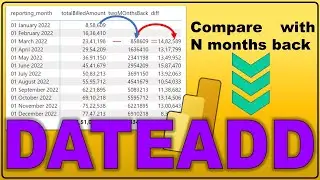
How to Compare the Current Month Value with Previous N Month in Power BI| #25.23
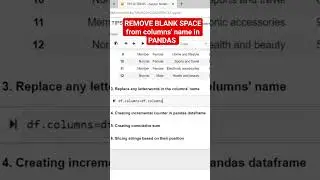
Remove blank spaces from columns' name in a
How to Automate Excel Work with Python using openpyxl | Learnerea
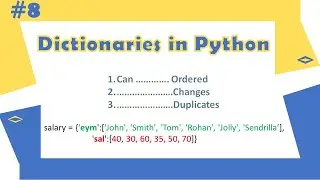
Python Tutorial - 8|Dictionaries in Python | Python for Beginners | Learnerea
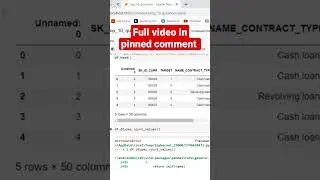
Credit Risk - Probability of Default, End-to-End Model Development | Beginner to Pro Level
TPOT | AutoML using TPOT | Automated Machine Learning | Learnerea
RANKX Function in Power BI with Examples| Use Case of RANKX Function in Power BI| #25.13
Dashboard Creation in Power BI | Beginner to Pro Level: Dashboard Creation in Power BI | #41
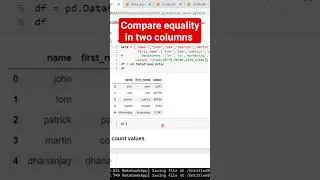
Compare equality of two columns in
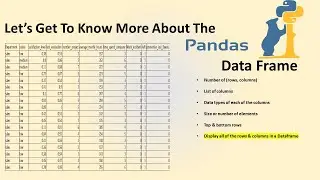
Know your pandas dataframe in python | Exploring the dataframe structure
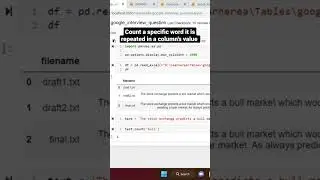
count a specific word how many times it is repeated in a Column's value in PANDAS
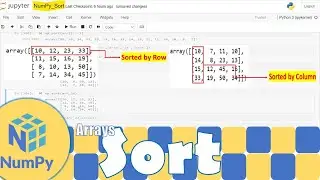
Python NumPy|Sorting a Numpy Array | Python for Beginners | Learnerea
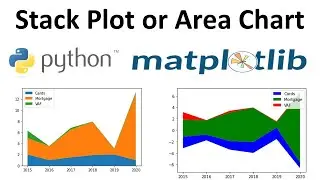
Stack Plot or Area Chart in Python Using Matplotlib | Formatting a Stack Plot in Python
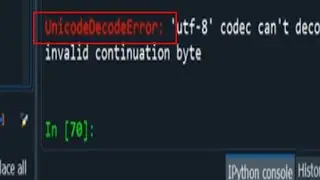
UnicodeDecodeError |
Explode in Pandas | List values to row values | Trick #2
Python Tutorial - 13|Defining Functions in Python | Python for Beginners | Learnerea
Mastering Feature Selection: With Chi Square Method | Part - 2
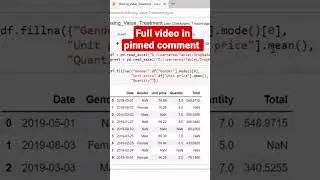
Fill missing with MEAN, MEDIAN and MODE in PANDAS
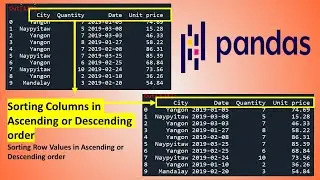
Sorting Columns and Row Values in a Pandas Dataframe in Python | Sort Columns using Pandas | Sorting
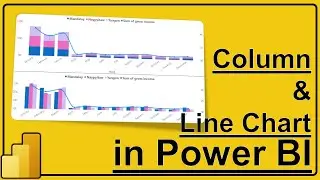
Combo Chart in Power BI | Stacked/Clustered Column & Line Chart in Power BI | #12
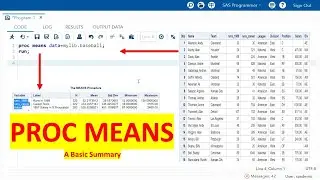
PROC MEANS - 1 | Proc Means in SAS | Basic Use of Proc Means to Summarize a Data Set
Count of Columns by DATA TYPE in PANDAS 🐼
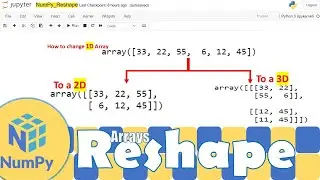
Python NumPy|Changing the Dimension/Shape of a NumPy Arrays | Python for Beginners | Learnerea
Regular Expressions in Python - 2| RE Module Functions in Python | Learnerea
Merging Magic: Combining Columns in Power BI| #35
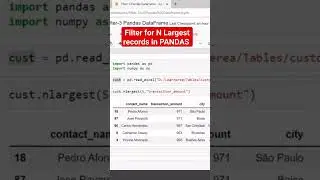
Filter for N Largest in PANDAS DataFrame
DATE IN SAS - 2 | INFORMATS and FORMATS in SAS | DATE INFORMATS and FORMATS in SAS
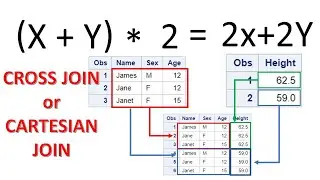
PROC SQL - 6 | Cross Join in SAS Proc SQL | Cartesian Join in SAS Proc SQL | Storing PROC SQL output
Uninstall Power BI | #2
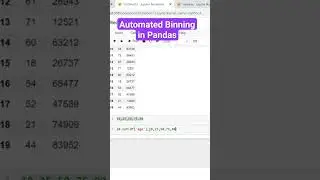
automated binning in