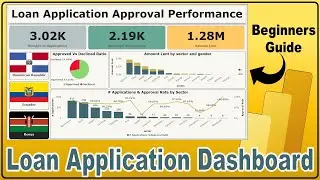
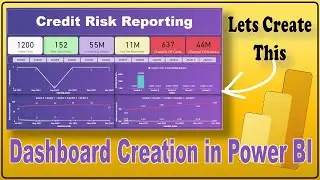
Dashboard Creation in Power BI | Beginner to Pro Level: Dashboard Creation in Power BI | #41
"How to Create a Dashboard from scratch in Power BI", "Credit Risk Reporting Dashboard in Power BI", "Beginner Level Dashboard Creation in Power BI", "How to Master the Dashboard Creation in Power BI"... all these questions have been answered in this video...
You may also like to watch -
Last Six months Trend in Chart - • How to Display Last Six Months Trends...
Conditional Columns in Power BI - • How to Create Columns Based on Condit...
Same period last year - • Mastering DateTime in Power BI: SAMEP...
Calendar vs Auto Calendar - • Date Functions in Power BI with Examp...
Power BI Full Playlist - • Power BI
Data Transformation and Analysis with Pandas - • Python Pandas Tutorial for Beginners ...
Visualization in Python with Matplotlib - • Python Matplotlib Tutorial for Beginn...
Visualization in Python with Seaborn - • Seaborn Beginner to Pro | Seaborn Tut...
Data Science Playlist - • Data Science
Statistics Playlist - • Statistics
NLP Playlist Complete - • NLP - Natural Language Processing
Complete Python Tutorial for Beginners - • Python for Beginners to Pro | Python ...
Complete NumPy Tutorial for Beginners - • NumPy
Credit Risk Reporting Data - https://github.com/LEARNEREA/Power_BI...
Credit Risk Reporting Dashboard - https://github.com/LEARNEREA/Power_BI...
For all the Power BI Files - https://github.com/LEARNEREA/Power_BI...
For all the Excel Files Used in Power BI Videos - https://github.com/LEARNEREA/Power_BI...
#Powerbi #PowerQuery #dataAnalysis #visualization #Learnerea