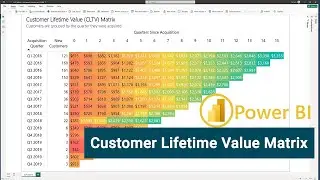
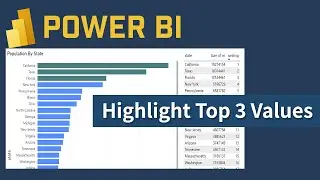
2 Ways To Highlight Top 3 Values In Power BI
In this Power BI tutorial, I will share two methods to highlight top 3 values.
Method 1 is using the RANKX function, is going to be the simply method. And for method 2, I will be using an analytics function called Window function, which is going to be a little more advanced, but offers more flexibility to enhance your visualization.
☕ Buy Me a Coffee? Your support is much appreciated!
-------------------------------------------------------------------------------------
🔑 PayPal Me: https://www.paypal.me/jiejenn/5
🔑 Venmo: @Jie-Jenn
📺 Learn Python, Excel, SQL: / jiejenn
💳 Support my channel so I can continue making free contents
---------------------------------------------------------------------------------------------------------------
💼 Join Robinhood with my link and we'll both get a free stock 🤝 https://join.robinhood.com/jiej6
📝 Patreon: / jiejenn
🛒 By shopping on Amazon → https://amzn.to/2JkGeMD
📧 Business Inquiring: YouTube@LearnDataAnalysis
#powerbi #pb #dashboard #dax


![[Ep.553, WEi] Еженедельный Айдол/Weekly Idol (рус.саб)](https://images.videosashka.com/watch/oWpe77N8Y2E)