Microsoft Power BI Tutorial For Beginners: Data Transformation & Merge Datasets
With Power BI Desktop, you can connect to many different types of data sources, then shape the data to meet your needs, enabling you to create visual reports to share with others.
In this Power BI tutorial, you'll learn how to:
Shape data by using Power Query Editor
Connect to different data sources.
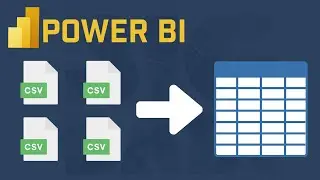
Combine those data sources, and create a data model to use in reports.
📋 Retirement Datset URL: https://www.fool.com/research/best-st...
📋 State Code Abbreviation URL: https://en.wikipedia.org/wiki/List_of...
📑 More information on Microsoft Power BI: https://powerbi.microsoft.com/en-us/
☕ Buy Me a Coffee? Your support is much appreciated!
-------------------------------------------------------------------------------------
🔑 PayPal Me: https://www.paypal.me/jiejenn/5
🔑 Venmo: @Jie-Jenn
📺 Learn Python, Excel, SQL: / jiejenn
💳 Support my channel so I can continue making free contents
---------------------------------------------------------------------------------------------------------------
💼 Join Robinhood with my link and we'll both get a free stock 🤝 https://join.robinhood.com/jiej6
📝 Patreon: / jiejenn
🛒 By shopping on Amazon → https://amzn.to/2JkGeMD
📧 Business Inquiring: YouTube@LearnDataAnalysis
#powerbi #pbi