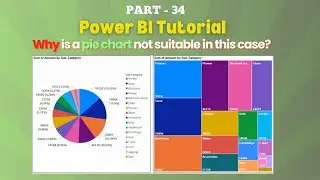
Part - 34 |Use a treemap, not a pie chart, when handling multiple categories? Why not use it | Hindi
Part - 34 |Use a treemap, not a pie chart, when handling multiple categories? Why not use it | Hindi
#piechart
#treemap
#comparison
#whynotuseit
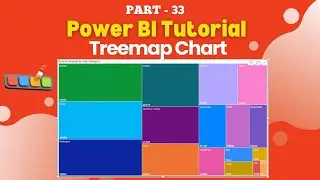
Part - 33 | How to Create Treemap Chart in Power BI | Use Treemap Visual | Chart Series | Hindi
• Part - 33 | How to Create Treemap Cha...
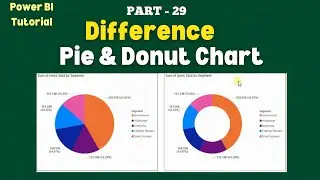
Part - 27 | How to Create Pie Chart in Power BI | Why do we use Pie Chart | Chart Series | Hindi
• Part - 27 | How to Create Pie Chart i...
Part - 11 | How to Create a Stacked Bar Chart in Power BI | Use a Stacked Bar Chart | Hindi
• Part - 11 | How to Create a Stacked B...
Download & install Fully Genuine MS office 2024 For Lifetime Free | Activation Key | Legal | Hindi
• Download & install Genuine MS office ...
How to download & install Genuine MS office 365 For Lifetime Free | Microsoft Office 365 | Hindi
• How to download & install Genuine MS ...
Download & install Fully Genuine MS office 2024 For Lifetime Free | Activation Key | Legal | Hindi
• Download & install Genuine MS office ...
Why choose a treemap over a pie chart for large datasets?
When is it better to use a treemap instead of a pie chart?
What are the advantages of a treemap compared to a pie chart?
Why are treemaps more effective than pie charts for multiple categories?
How does a treemap improve data visualization over a pie chart?
What makes treemap charts superior to pie charts for category comparisons?
Why are pie charts less ideal for complex datasets?
When should you use a treemap rather than a pie chart?
Why avoid pie charts for multiple data points?
What’s the benefit of using a treemap for multi-category data?
Why is a treemap chart a better option than a pie chart for intricate data?
When does a treemap outperform a pie chart in data analysis?
Why is a pie chart less useful than a treemap for detailed datasets?
What makes a treemap a better visualization tool than a pie chart?
How does a treemap offer clearer data insights than a pie chart?
Why are treemap charts recommended for visualizing large datasets?
Why should you consider a treemap over a pie chart for complex information?
What’s the difference between a treemap and a pie chart for data representation?
Why choose a treemap for displaying multi-level data instead of a pie chart?
How does a treemap handle multiple categories better than a pie chart?
Follow me on :-
Instagram :- / santoshchauhann
Facebook Page :- / santosh-chauhan-111257958368184
Twitter :- / sainn29


![[Free] Ajna Type beat - Redescente](https://images.videosashka.com/watch/KkTX3XAV1Rc)


Part - 41 | A Step-by-Step Guide: How to Build and Customize a Matrix in Power BI | Hindi


Part - 38 | Simple Guide to Designing KPIs in Power BI | Build and Visualize KPIs | Hindi