1 тысяч подписчиков
623 видео
✅👍 समाधान मिल ही गया | Solution | Remove Symbol | Insert Country Flag ? | Microsoft Excel | Hindi
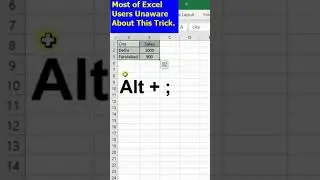
Copy Visible Cells Only | Use Alt+; shortcut key
No VBA | No Delimiter | How to Extract Mobile Number from mixed data by formula in excel | Hindi
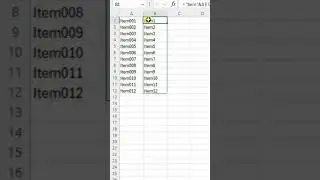
Excel Trick- How to get MULTIPLE COLUMNS DATA into SINGLE COLUMN in Excel| No VBA| No Formula| Hindi
Question & Answer | How to Extract Mobile Number from mixed data by formula in excel | Hindi
VBA code to Merge and Unmerge selected cells or range in Excel VBA in Hindi
Download & install Genuine MS office 2024 for Free | Activation Key | Legal | Genuine Version |Hindi
Missing Share Workbook | How to Enable Share Workbook Button If not available in Excel 2016 & Above
How to use XMATCH FUNCTION with examples in Excel | Fully Explained | Hindi
Part - 17 | How to Create Line Chart in Power BI | Use Line Chart | Display Line Chart | Hindi
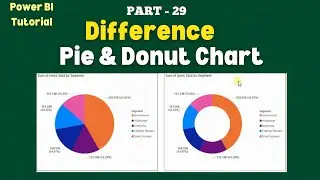
Part - 29 | Difference between Pie and Donut Chart in Power BI | Chart Series | Hindi
Part - 30 | Fix: How To Enable "Map and filled map" Error In Power BI | Hindi
Part - 35 | How to Create Gauge Chart (or needle) in Power BI | Speedometer Chart | Hindi
Part - 19 | How to Create Stacked Area Chart in Power BI | Difference | Area Vs Stacked Area | Hindi
Part - 10 | Choosing Right Visuals for your reports & Dashboards in Power BI | Hindi
Simplifying Excel: Removing Error Values Like a Pro | Removing Errors Without Losing Data | Hindi
Part - 38 | Simple Guide to Designing KPIs in Power BI | Build and Visualize KPIs | Hindi
Part - 13 | How to Create Clustered Bar Chart in Power BI | Use Clustered Bar Chart | Hindi
Part - 11 | How to Create a Stacked Bar Chart in Power BI | Use a Stacked Bar Chart | Hindi
❔ Do you know it?
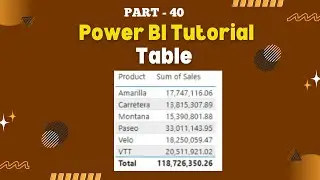
Part - 40 | Step-by-Step Guide: Creating Tables in Power BI | Table Creation Guide | Hindi
Part - 18 | How to Create Area Chart in Power BI | Difference between Area Vs Line Chart | Hindi
Part - 32 | How to Create Filled Map in Power BI | Use Filled Map | Chart Series | Hindi
Quick Guide: Removing Error Values in Excel Using Find and Replace Functionality | Hindi
Part - 44 | Power BI Decomposition Tree Visual | Data Analysis के लिए Decomposition Tree | Hindi
Part - 25 | How to Create Funnel Waterfall Chart in Power BI | Use Funnel Chart |Chart Series |Hindi
Part - 43 | Power BI Conditional Formatting: Best Practices for Stunning Reports | Hindi
Part - 34 |Use a treemap, not a pie chart, when handling multiple categories? Why not use it | Hindi
👍✅🤦♂️😎 Excel Interview | Solve It | Sum Errors Values
Part - 45 | Power BI Essentials: How to Create and Utilize New Card Visual | Hindi
Part - 23 | How to Create Ribbon Chart in Power BI | Use Ribbon Chart | Chart Series | Hindi
❔👀✨🌟 Question & Answer | How to Extract Multiple Mobile # by using formula in Excel | Hindi
❔ Why use $ (Dollar) Symbol in Excel Formula? | Why Cell Freeze/Lock (F4) | Explained | Hindi
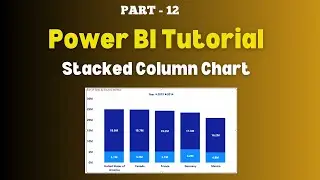
Part - 12 | How to Create a Stacked Column Chart in Power BI | Use a Stacked Column Chart | Hindi
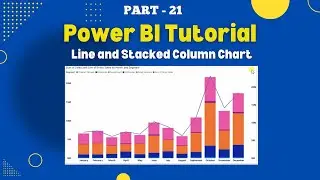
Part - 21 | How to Create Line and Stacked Column Chart in Power BI | Chart Series | Hindi
Part - 47 | Old Card vs. New Card in Power BI: Features, Functionality and Design Changes | Hindi
Part - 39 | How to Easily Add Slicer in Power BI: A Beginner’s Guide | Filter Vs Slicer | Hindi
Part - 33 | How to Create Treemap Chart in Power BI | Use Treemap Visual | Chart Series | Hindi
Part - 36 | Step-by-Step Guide: Creating Card Visuals in Power BI | Easy Card Visual Creation |Hindi
Part - 24 | How to Create Waterfall Chart in Power BI | Use Waterfall Chart | Chart Series | Hindi
Part - 15 | How to Create 100% Stacked Bar Chart in Power BI | Use 100% Stacked Bar Chart | Hindi
Part - 31 | How to Create Map Chart in Power BI | Use Format Option | Chart Series | Hindi
Part - 22 | How to Create Line and Clustered Column Chart in Power BI | Chart Series | Hindi
Part - 9 | Power Bi Vs Tableau | Power Bi And Tableau Difference | Data Visualization Tool | Hindi
Part - 20 | How to Create 100% Stacked Area Chart in Power BI | Use 100% Stacked Area Chart | Hindi
Part - 28 | How to Create Donut Chart in Power BI | Use Donut Chart | Percentage View | Hindi
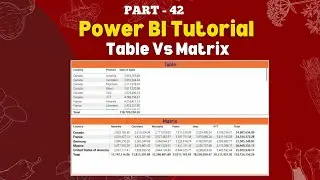
Part - 42 | Table vs Matrix in Power BI: Which One Fits Your Data Best? | Visuals Simplified | Hindi
Part - 46 | Create Eye-Catching Card Visuals with Image and Accent Bar in Power BI | Hindi
Part - 27 | How to Create Pie Chart in Power BI | Why do we use Pie Chart | Chart Series | Hindi
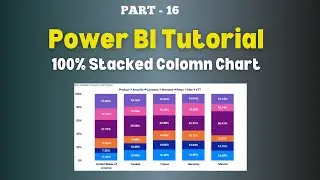
Part - 16| How to Create 100% Stacked Column Chart in Power BI |Use 100% Stacked Column Chart |Hindi