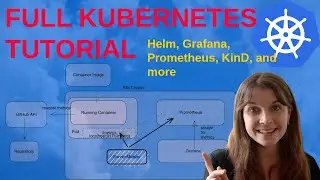
Full Tutorial: Monitoring and Troubleshooting stack with Prometheus, Grafana, Loki and Komodor
This tutorial provides an A to Z overview for setting up your monitoring stack with Grafana, Prometheus, Loki and Komodor. Each step is provided in the tutorial as well as in the blog post: https://anaisurl.com/full-tutorial-mo...
Additional Resources:
Git Repository: https://github.com/AnaisUrlichs/monit...
Komodor website: https://komodor.com/
Prometheus Stack Operator Chart: https://github.com/prometheus-communi...
Loki docs: https://grafana.com/docs/loki/latest/
Join the Community:
Community Chat: https://community.100daysofkubernetes...
Weekly DevOps Newsletter: https://anaisurl.com/tag/devops/
⌚Timestamps⌚
00:00 - Intro Overview
02:40 - Set up Civo Kubernetes Cluster & other Prerequisites
05:48 - Install Prometheus and Grafana
14:06 - Install Promtail and Loki
16:52 - Install example application
21:48 - Install the Komodor Agent
24:54 - Client and Metrics
27:37 - Updating deployment
28:45 - Debugging our deployment
36:29 - Outro

![[FREE] SLIMESITO x BEEZYB TYPE BEAT 2022 -](https://images.videosashka.com/watch/1EoTITwenvE)


