Full Tutorial: AlertManager Set up and PrometheusRules
This video showcases how to install the kube-prometheus-stack Helm Chart operator, including AlertManager and configure AlertManager and the alerts we want to be notified about.
The blog post for this video: https://anaisurl.com/forwarding-secur...
The repository for this video: https://github.com/Cloud-Native-Secur...
-----------------------------------------------------------------------------------------------------------------------
In this tutorial, we will:
Install the kube-prometheus-stack Helm Chart
Configure Prometheus Operator and AlertManager
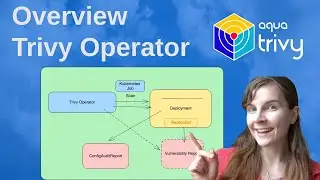
Install the Trivy Operator for continuous security scanning and accessing security metrics
Set up alerts to receive notifications on specific metrics present in the cluster or missing
-----------------------------------------------------------------------------------------------------------------------
Additional resources
Full tutorial on Prometheus monitoring: • Full Kubernetes tutorial on Docker, KinD, ...
Full Tutorial: Monitoring and Troubleshooting stack with Prometheus, Grafana, Loki and Komodor: • Full Tutorial: Monitoring and Troubleshoot...
Helm Tutorial: • Manage Your Helm Chart with Helm Commands:...
-----------------------------------------------------------------------------------------------------------------------
NOTE: To clean everything up in the cluster delete the three namespaces:
kubectl delete ns monitoring
kubectl delete ns trivy-system
kubectl delete ns test
-----------------------------------------------------------------------------------------------------------------------
🕒Timestamps🕒
00:00 - Introduction
01:31 - Component Overview in Graphic
03:57 - Kubernetes Cluster
05:26 - Detail Prometheus Configuration
14:10 - Install Prometheus Helm Chart
16:50 - Access Grafana Service
18:14 - Install Trivy Operator Helm Chart
25:03 - Set up PrometheusRules for Alerts
32:25 - View Alerts in the Prometheus UI
33:12 - Trigger an Alert
41:10 - Outro


