Tutorial: Displaying Graphs in MATLAB
Display Graphs in MatlabEdit this section
Created and recorded by Yiming Cai, November 2021
Music: Twilight Area (https://www.lmms.io/lsp/?action=show&...) by Alf42red (https://www.lmms.io/lsp/?action=brows...) License: Creative Commons
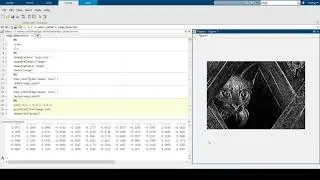
Matlab graph display: add xy axis for image display
Matlab graph display: xy function relationship graph
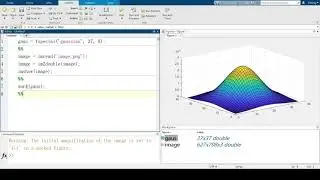
Matlab graph display: xyz function relationship graph
In the previous video for edge detection, I received a comment that said: is it possible to label the x-axis and y-axis of an image?
So to answer this comment, in this video, I will talk about some tricks for Matlab plots. Also, I will cover tricks for plotting at different dimensions
So the first thing I would like to do is to answer the question. To label x-axis and y-axis on the image, the answer is yes.
imshow('image.png');
axis on
hold on;
% Plot cross at row 100, column 50
plot(50,100, 'r+', 'MarkerSize', 30, 'LineWidth', 2);
After the axis is on, you can use the mouse to locate the x and y coordinate that you are looking for by moving the mouse on the plotting image. You can also click and add a label after plotting. If you find the coordinate by using some calculations such as edge detection algorithms, just need to plot the coordinate on the plotting image.
Now let's begin with the plotting of 2d line function.
For the text version tutorial, please google 2D-line plot Matlab. They offer a very nice description on their page
https://www.mathworks.com/help/matlab...
The first thing we want before plotting is to make a function for plotting
x = 0:pi/100:2*pi;
y = sin(x);
plot(x,y)
The value of x is usually a range of numbers. In this case, x starts with 0, ends with pi, plots every 0.314 units. And the corresponding y coordinate will also be plotted with the plotting command.
Now to add something to the plotted graph, we add a hold on command. The hold-on command can keep the plotting window on so the original graph won’t disappear. To close the hold on, use hold off.
There are two ways to plot multiple lines on one graph. The first one is to plot a new line on an existing plot.
y1 = 2x
axis on
Plot(x, y1)
Or you can plot two lines together just using one plot command:
hold off
figure
plot(x, y, x, y1)
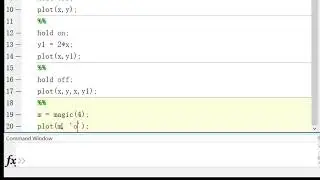
Also, the plot command can plot a matrix:
m=magic(4)
plot(m)
Also, Matlab can change the looks of plotted points and lines, to do this, add signs like ‘-’, ‘r’, ‘*’ at the end of the plotting command, then you can change the look of your plots.
We now know about 2d line plots, how about 3d line plots?
So the 3d line plots command is plot3. This command usual takes at least 3 arguments as input, x, y and z.
By using plot3, you can either plot 3d lines or 3d cloud points.
Again, let's start with the basic example
t = 0:pi/50:10*pi;
st = sin(t);
ct = cos(t);
plot3(st,ct,t)
This is an example of 3d line plots. How about cloud points plotting?
To plot the cloud point version of the example, we add a circle marker at the end of plot3 command
plot3(st, ct, t, ‘o’)
Plot again, you will see the plot became cloud point. But what if we want to keep both lines and points?
plot3(st, ct, t, ‘-o’)
So now the plot contains both lines and points.
So in this video, I talked about the basic plotting skills in Matlab for 2d and 3d line plots. Next video I will talk about the contents related to the plotting of 3d matrix, and slice of 3d plots and multi-dimensional matrix. Hope this video is helpful


