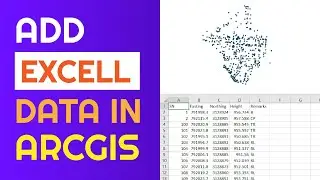
How To Make Time Series Animation Using QGIS || Earthquake Data Visualization In QGIS || GeoFox
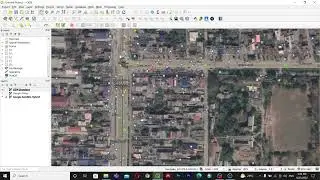
Make time series animation of earthquake data using QGIS.
Data from: https://earthquake.usgs.gov/earthquak...
#QGIS
#QGIS_Tutorial
#Earthquake
#Earthquake_In_Nepal
#GeoFox
#Time_Series_Map
------------------------- My Other Videos --------------------------------
Do watch my other videos:
How To Create A Covid-19 Map Using QGIS
• How To Create A Covid-19 Map Using QG...
Supervised Classification Using ArcGIS:
• Supervised Classification Using ArcGI...
How To Create A Map With OSM Data Using QGIS:
• How To Create A Map With OSM Data Usi...
How to Create A Choropleth Map Using Leaflet:
• How To Create A Choropleth Map Using ...
Create A Map Layer Using Leaflet:
• Leaflet JS Tutorial || Create A Map L...
Add A Marker To The Map Layer:
• Leaflet JS Tutorial || Add A Marker T...
Use Different Map Tile Layer In Leaflet:
• Leaflet JS Tutorial || Use Different ...
Add Google Map To Your Website:
• Leaflet JS Tutorial || Add Google Map...
Layer Group And Control In Leaflet:
• Leaflet JS Tutorial || Layer Group An...
Add Shapefile in leaflet:
• Leaflet JS Tutorial || Add Shapefile ...
How to add GeoJSON File in leaflet:
• Leaflet JS Tutorial || Use GeoJSON Wi...
-------------------------------------------------------------
Keywords:
earthquake, earthquake in nepal, nepal, qgis, qgis tutorials, make map using qgis, time series animation, time series animation using qgis, earthquake data visualization, data visualization in qgis, data visualization, time series map, time series using qgis, time series map using qgis, geographic information system, gis, GeoFox


![COLLAPSE [Doom] 13000 MMR Offlane Show His Signature Hero Dota 2](https://images.videosashka.com/watch/cEa3yB8XfvQ)


![[You Can't Get] Love From A Stone](https://images.videosashka.com/watch/j7jTbhXGbxs)

