How humans combine visual and haptic information
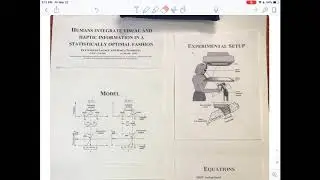
Poster by: Charles Lagace and Surya Penmetsa. Thanks to the feedback from Prof. Michael Langer.
Paper:
"Humans integrate visual and haptic information in a statistically optimal fashion", M. O. Ernst and M. S. Banks, Nature 2002. (link: http://www.cns.nyu.edu/~david/courses...)
Note: During the poster, the explanation length varied from 1 minute to 3 minutes. Mostly so that it'll give people time to ask specific questions where they want to know more. I went in more detail here as I did not have any time restrictions.
====
Rough transcript:
When we look at an object while touching it with our hand, our brain combines both cues to estimate the properties of that object. This paper attempts to study how that combination takes place. The hypothesis of the authors is that the nervous system uses maximum-likelihood estimation (MLE) to combine these inputs.
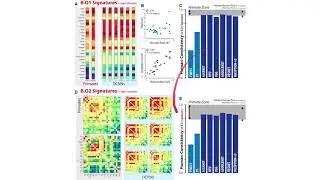
As studied in class, MLE combines inputs using these equations (1-3); (1) shows the predicted mean and (3) shows predicted variance. They can we written in terms of detection thresholds like this (4-6) but let's focus on the general idea of the paper more than the math first. The combination of Gaussian is shown in this image.
The paper does vision-only experiment to determine the properties of this gaussian, haptic-only experiments to determine the properties of this gaussian and vision-haptic experiments for this gaussian. It then checks if they satisfy MLE.
Experiment is setup such that experiments can be performed in all three modes. Haptic feedback is obtained from feeling each ridge under a mirror, whereas visual feedback is obtained from simulated images reflected on that mirror. The task is to compare the height of a standard ridge to a test ridge; response is plotted as a psychometric function of the height of test ridge. Experiments were performed at multiple noise-levels of the visual input for more extensive testing.
The psychometric curves of the vision-only and haptic only are shown on the left (red represents haptic-only, blue represents various visual-only experiments at varying noise levels); and combined is shown on the right where conflicting cue information is presented.
The ratio of weights is predicted from (5) using the results on vision-only and touch-only experiments and compared with the empirical observations from plot(b); they are quite similar. The detection thresholds are predicted from (6) and compared with empirical observations from plot(b); they are quite similar too. Hence, the authors hence conclude that the brain is doing MLE.












![What does it mean to understand a neural network? [dry run]](https://images.videosashka.com/watch/TQU6bx5k_4U)
