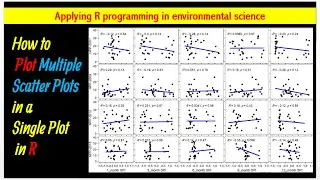
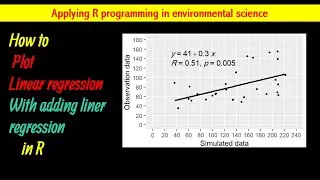
How To Plot Simple Linear Regression With Adding Liner Regression In R Studio||
In this video you will learn how to plot linear regression in R studio and the code needed to do the regression models. If you are learning learning statistics and quantitative analysis in r program then this is a good tutorial for you.
Linear Regression in R, Step by Step
Linear regression using R programming
Simple Linear Regression in R | R Tutorial 5.1 | MarinStatsLectures
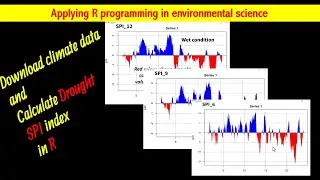
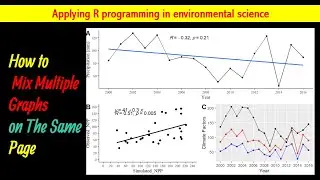
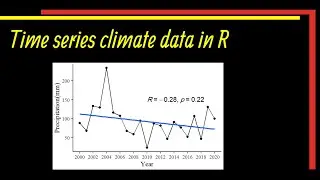
☑️How to Make Time Series Climate Data in R | #Trend Data in R | Plot Time Series
• How to Make Time Series Climate Data ...
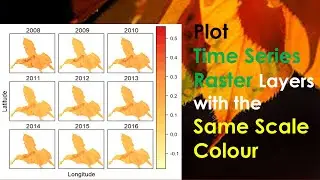
☑️How to Plot #ndvi time series in R Studio|| Normalized Difference Vegetation Index
• How to Plot #ndvi time series in R...
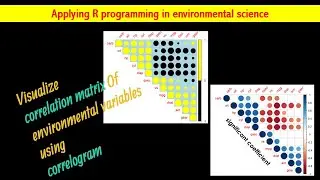
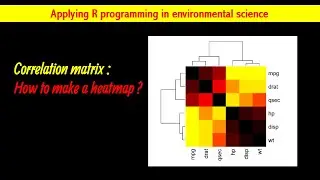
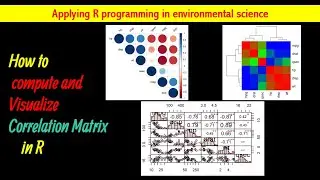
☑️Plot Pearson Correlation Coefficient of Multiple Variables|| R Studio
• Plot Pearson Correlation Coefficient ...
If you like my video don't forget to like, share and subscribe to my channel.
/ @resneed1
🙏Thank you so much for watching.🙏
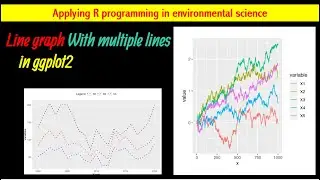
#ggplot
#ggplot2
#rprogramming
#visualization