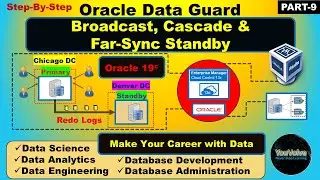
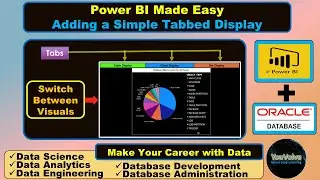
How to Add a Tabbed Display in Your Report - Learning Power BI & Oracle Database - [Part-5]
Today's tutorial is about an alternative for a Tabbed Display in power BI. A tabbed display is a control where you can accommodate multiple visuals and display them based on tabs or buttons.
For example, Windows Task manager where we can see a series of tabs or button at the top and each of them corresponds to a different display within the same area.
The tabbed display is a very useful control using which you can efficiently manage a designated space in the report page. Say you have a report with one page and you need to display multiple visuals without adding a new page to the report. In that case you can use a tabbed display. However in Power BI there is no straight forward way of achieving this. There is no such one visual control like a tabbed display in Power BI. So, pleased watch this video to learn this workaround.
In this tutorial I have used an existing test report that we designed in the first part of this video series. If you have not watched that video please watch that first to understand how to design a simple report with a table and pie-chart in Power BI using Oracle database as data source.
The link to that video is:
• Step by Step - Create a Simple Tabula...


![Manual Upgrade of OEM Agent v13.4 to v13.5 [Part-2]](https://images.videosashka.com/watch/1eZFVGMqtYw)
![Manual Installation and Upgrade of OEM 13c Agent [Part-1]](https://images.videosashka.com/watch/CBiR4b2Byso)