Capital BikeShare Data Visualization
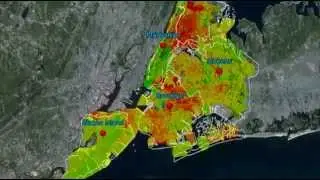
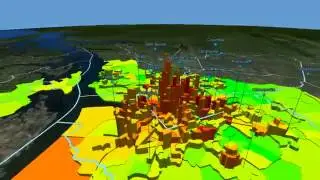
This animation shows over 32,000 trips on the Capital Bikeshare from October 4-8 2012. (Wednesday-Sunday) Data available here: http://www.capitalbikeshare.com/trip-....
Blue dots are trip starts, and fade away immediately after appearing. Yellow dots show the interpolated path between start station and end station over time.
Visualization by @chris_whong - Made in NYC
Made with Processing. (processing.org)
Attribution:
"GeoTrails" by Dave Troy:
github.com/davetroy/GeoTrails/blob/master/GeoT
rails.pde
Music by dan-o www.danosongs.com


![Gangsta's paradise - SX18 Eden: Bounty - Gate 6 lvl entrance - 670 UaO vs 579 goW [Rise of castles]](https://images.videosashka.com/watch/nBwtVbFucj8)