Made with ArcScene and U.S. Census Data. Density is represented by elevation, Median Income is represented by color (red = lowest and green = highest)
КИБЕРСПОРТИЫНФЙ ГЕЙМПЛЕЙ ВЕДЬМАК 3
DEEPIN 23 FINALLY RELEASED!!!!
Новый скин ❤️
как настроить информатор
Horizon Zero Dawn: Initial PS4/PS4 Pro Gameplay Frame-Rate Test
How to Change Background Color in Adobe InDesign 2024 [Easy Solution]
Raspberry Pi: ACT LED is not blinking but it is blinking for another RPi inserting same sd card
Как сделать сыр дома / ЧИЛИ ЧЕДДЕР с самым жгучим перцем ( Авторский Сыр Ольги Елисеевой)
leaflet intro
WitWiCS S2E26 - The Brazen Bean Bamboozlement - 2 November 1992
Van Isle Sailing Race Google Earth Track Flyover
New York City Subway Turnstile Data Animation
Charm City Circulator Real-Time Data Movements with Google Maps Traffic Layer
Opie eats his breakfast one kibble at a time
Capital BikeShare Data Visualization
Puggle Eyebrows - A short film
3D GIS Animation - New York City Median Household Income
Arduino Air Conditioner Remote from Website%21
Control a Hexbug using Arduino and Pusher.com Websockets
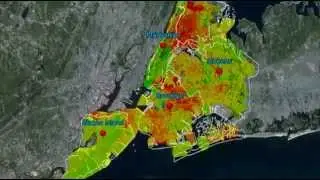
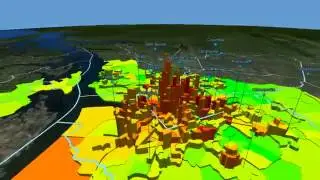
3D GIS Animation of Baltimore MSA showing Density vs. Income