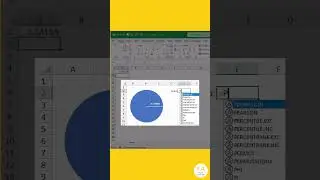
How to Insert a Picture in a Chart in Excel - Tutorial
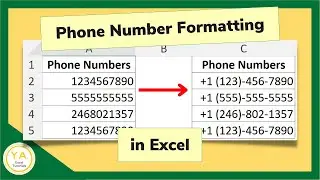
Excel tutorial on how to insert a picture in a chart in Excel, i.e., how to make a Pictograph in Excel.
Using a picture for symbols in Excel charts can help make your charts more personal and impactful.
In this tutorial, we create a pictograph by inserting a picture we've already saved to symbolize the different quantities in our chart.
And, If you liked this, make sure to get your FREE pdf list of top Excel keyboard shortcuts: https://yacostasolutions.com/newsletter/
***************************
For more on how to use charts in Excel, take a look at these other tutorials:
How to Make a Pivot Table Chart in Excel - Tutorial: • How to Make a Pivot Table Chart in Ex...
How to Make a Goal Thermometer in Excel - Tutorial: • How to Make a Goal Thermometer in Exc...
How to Create a Map Chart in Excel - Tutorial: • How to Make a Map Chart in Excel - Tu...
How to Use Excel Sparklines - Tutorial:
• How to Use Sparklines in Excel - Tuto...
*FYI:
This tutorial was created using the desktop version of Excel in Microsoft 365. You can upgrade to this version here: https://yacostasolutions.com/MS365
The screen recording + editing was done using Techsmith Camtasia. You can check it out here: https://yacostasolutions.com/camtasia
Thanks for watching this Microsoft Excel tutorial and, don’t forget, if you like this video, please “Like” and “Share” with your friends – it really helps us out 😊
To catch our Excel tutorials as they come out, subscribe to this channel by clicking: https://yacostasolutions.com/youtube
Thanks!
*DISCLAIMER: This video description contains affiliate links, which means that if you click on one of the product links, I’ll receive a small commission. As an Amazon Associate I earn from qualifying purchases. This helps support the channel and allows us to continue to make tutorials like this. Thank you for your support!
#YAcostaTutorials