Real-Time Sensor Data Monitoring and PDF Reporting with MongoDB in Node-RED
Real-Time Sensor Data Monitoring and PDF Reporting with MongoDB in Node-RED
#noderedtutorials #nodered #mrtechbangalore #iot
Description:
Welcome to our latest tutorial on building a powerful real-time sensor data monitoring and PDF reporting system using Node-RED and MongoDB! In this video, we will guide you step-by-step through the process of setting up a dynamic dashboard to visualize sensor data and generate detailed PDF reports with just a click.
📌 In This Video, You Will Learn:
Setting Up MongoDB: How to configure MongoDB to store sensor data.
Creating Node-RED Flows: Building Node-RED flows to fetch, process, and display real-time data.
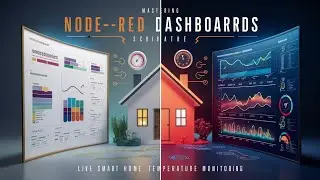
Visualizing Data: Setting up a dynamic dashboard to monitor sensor values using a line chart.
PDF Reporting: Implementing a feature to export data visualization into a PDF report.
Using UI Elements: Adding buttons for refreshing data and exporting charts.
🛠️ Tools and Technologies Used:
Node-RED
MongoDB
pdfmake
UI Dashboard
🔗 Resources:
Flow Code : https://github.com/joshi-sandeep/NODE...
Node-RED Official Documentation: https://nodered.org/
MongoDB Documentation : https://www.mongodb.com/
pdfmake Documentation : https://www.npmjs.com/package/pdfmake
⏰ Timestamps:
00:00 – Introduction
– Setting up MongoDB
– Creating Node-RED Flows
– Visualizing Data with UI Dashboard
– Implementing PDF Reporting
– Testing and Demonstration
👍 If you enjoyed this video, please:
Like the video
Subscribe to our channel for more tutorials
Share with your friends and colleagues
💬 Have Questions or Suggestions?
Feel free to leave a comment below. We love hearing from you and are here to help!
🔔 Stay Connected:
Follow us on Instagram: @MrTechBangalore
Join our Facebook Group: / 636526210071024
Thank you for watching and happy coding!