Build 5 ADVANCED Excel Charts from Scratch
Create advanced excel charts (forecast chart, waterfall chart, column chart etc.)
👉 Sign up to Morning Brew: https://morningbrewdaily.com/kenjiexp...
🆓 DOWNLOAD Free Excel file for this video:
https://view.flodesk.com/pages/62daa6...
In this video you'll learn to create 5 dynamic advanced excel charts.
In level 1, we'll go over a dynamic doughnut chart, where the centre will include the customer satisfaction score out of 100% dynamically linked.
In level 2, we'll go over a budget vs actuals charts. This will start as a column chart and by changing the second axis and the column widths we'll active a progress bar chart.
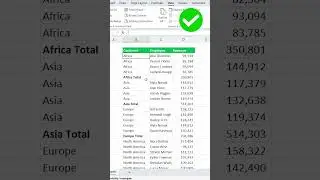
In level 3, we'll go over a waterfall chart, which allows us to track progress over time.
In level 4, we'll go over a forecast chart, which allows you to forecast how a certain trend is going to evolve in the future. In our case, we use Netflix shares as an example.
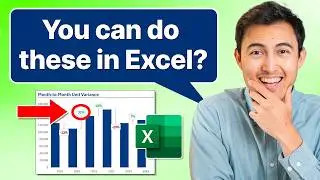
Lastly, in level 5, we go over a complex column chart with a percentage change to showcase the revenue trend in more detail.
LEARN:
📈 The Complete Finance & Valuation Course: https://www.careerprinciples.com/cour...
👉 Excel for Business & Finance Course: https://www.careerprinciples.com/cour...
📊 Get 25% OFF Financial Edge Using Code KENJI25: https://bit.ly/3Ds47vS
USEFUL SOURCES:
Excel Campus: https://www.excelcampus.com/charts/co...
Xelplus: https://www.xelplus.com/excel-progres...
SOCIALS:
📸 Instagram - https://www.instagram.com/careerprinc...
🤳 TikTok - / career_principles
🧑💻 LinkedIn - / careerprinciples
GEAR:
📹 My Favorite Books & Gear: https://kit.co/kenjiexplains
▬▬▬▬▬▬▬▬▬▬▬▬▬▬▬▬▬▬▬▬▬▬▬▬▬▬▬▬▬▬▬▬▬▬▬▬▬▬▬▬
Chapters:
0:00 - Level 1 Doughnut Chart with Textbox
2:57 - Level 2 Progress Column Chart
5:59 - Level 3 Waterfall Chart
7:42 - Level 4 Forecast Chart
9:20 - Level 5: Column Chart with % Change
Disclaimer: I may receive a small commission on some of the links provided at no extra cost to you.