Gantt Chart Template: How to Use Gantt Charts in Excel
Learn how to create a GANTT Chart in Excel while following along with our template.
Grab the template here: https://docs.google.com/spreadsheets/...
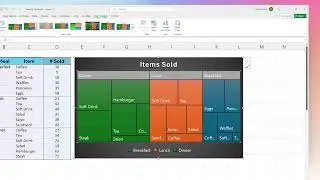
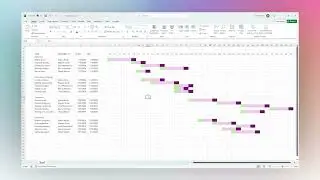
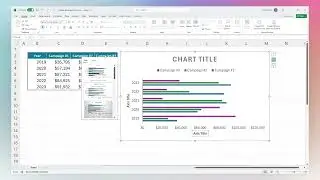
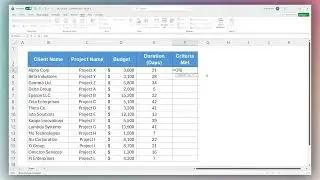
A Gantt chart is a popular project management tool used to visualize a project's schedule. It displays the start and end dates of various elements of a project, helping in planning, coordinating, and tracking specific tasks.
Creating a Gantt chart in Excel can be particularly useful for several reasons, including project planning, tracking progress, resource allocation, deadline management, and communication.
► For more more tips and tricks regarding spreadsheets, check out our blog: https://coefficient.io/blog?utm_mediu...
► Come see us: https://coefficient.io/product?utm_me...
Any questions? Comment below; we have Google Sheets experts on the other side.
#ganttchart #gantt #ganttcharts #excel #exceltips #exceltutorials #spreadsheets