How to Use Standard Deviation in Excel: STDEV.P vs STDEV
Learn to use stand deviation in Excel. Standard deviation is a statistical measure that quantifies the amount of variation or dispersion in a set of values.
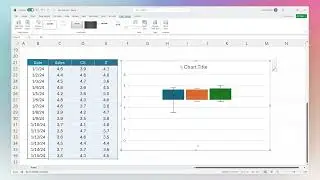
In Excel, standard deviation is commonly used for data analysis to understand how spread out the values in a dataset are. It helps in identifying the consistency of data points, comparing different datasets, and performing various statistical analyses.
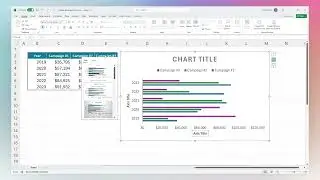
You might use it to measure variability, compare data, control quality, assess risk, or for traditional statistical analysis.
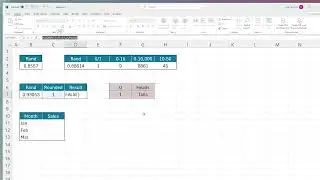
STDEV.P: Uses the formula for standard deviation that divides by the number of data points (n).
STDEV.S: Uses the formula for standard deviation that divides by the number of data points minus one (n-1), which corrects the bias in the estimation of the population standard deviation.
► For more more tips and tricks regarding spreadsheets, check out our blog: https://coefficient.io/blog?utm_mediu...
► Come see us: https://coefficient.io/product?utm_me...
Any questions? Comment below; we have Google Sheets experts on the other side.
#standarddeviation #stdev #excel #exceltips #exceltutorials #spreadsheets