Introduction to statistical tables - Organizing and presenting data
My other channels:
Subscribe for more content
Stata dojo: / @statadojo
Biostatistics: / biostatisticsfortherestofus
Public Health: / publichealthresources
SPSS: / @spss4research
EPI Info: / epiinfoforrookiese4r
Tiktok: / public_health_resources
This is part of a full course on biostatistics. we have in the previous study session described the various methods of data collection for any statistical inquiry. Unfortunately, the data collected in any statistical investigation is known as raw data and also voluminous and usually unwieldy and incomprehensible. So having collected and edited the data the next important step is to organize it so as to present it in a really comprehensible and condensed form which will highlight the important characteristics of the data and facilitate comparisons. In this short lecture, I describe the meaning of a table, the uses of tables, the advantages of a table, the different types of tables, and how tables can be used in statistics.
This lecture introduces the basic concept of data presentation by explaining the tabular method of data presentation. The next lecture is going to feature how to construct tables by hand and subsequent lectures would cover how to construct tables using computer software.
Timestamps
0:00 Introduction
1:20 Outline
3:14 Statistical Enquiry
6:20 Important example
9:20 Organizing Data- Tabular form
9:55 What is a table?
11:14 Advantages of Tables
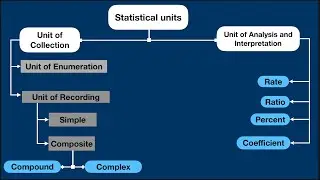
12:50 Parts of a table
13:55 Major parts of a table(4)
15:35 Minor parts of a table(5)
18:40 Example of Major parts of a table
19:40 Example of Minor parts of a table


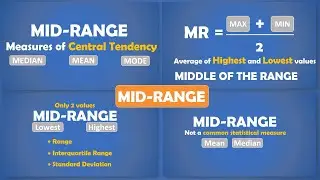
![Measures of Central tendency: MID-RANGE for Ungrouped data [MID-EXTREME] #maths #mathematics](https://images.videosashka.com/watch/Fo3yaA61LPk)