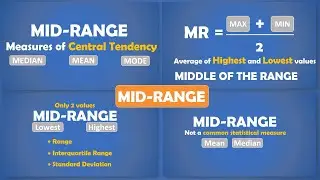
Measures of Central tendency: MID-RANGE for Ungrouped data [MID-EXTREME]
In Statistics, the mid-range is often used in data analysis to refer to a statistical measure of central tendency. It is calculated by taking the average of the maximum and minimum values in a dataset. In other words, it represents the midpoint between the highest and lowest values.
It's important to note that the mid-range is a relatively simple measure of central tendency and is not as commonly used as other measures like the mean or median. While it can provide a rough estimate of the center of the dataset, it does not capture the overall distribution or account for the variability in the data.
Subscribe to my other AMAZING channels:
Biostatistics: / biostatisticsfortherestofus
Public Health: / publichealthresources
SPSS: / @spss4research
EPI Info: / epiinfoforrookiese4r
Tiktok: / public_health_resources
Attributions:
➤ Icons are from flaticon.com - www.flaticon.com/free-icons/true-or-false" title="true or false icons"True or false icons created by Freepik
➤ Audio from storyblocks.com
Attributions:
➤ Icons are from flaticon.com and Storyblocks
➤ Audio from storyblocks.com


![Measures of Central tendency: MID-RANGE for Ungrouped data [MID-EXTREME] #maths #mathematics](https://images.videosashka.com/watch/Fo3yaA61LPk)