📊Univariate Analysis : Exploring Data Trends and Patterns📈
Univariate Analysis on the "Tips" Dataset: Exploring Data Trends and Patterns
Are you ready to uncover fascinating insights from the "Tips" dataset through univariate analysis? In this tutorial, we'll dive into the world of univariate analysis, focusing on one variable at a time to reveal hidden trends and patterns. Using Python and popular libraries like Pandas, Matplotlib, and Seaborn, we'll explore various aspects of the dataset, from basic statistics to visual representations.
🔍 Understanding the "Tips" Dataset:
Before we dive into analysis, let's familiarize ourselves with the "Tips" dataset. It contains information about tips given by restaurant customers, along with other relevant factors such as total bill amount, gender, day of the week, time of day, and more.
📊 Basic Statistical Analysis:
We'll start by performing basic statistical analysis on key variables in the dataset. Explore measures like mean, median, mode, standard deviation, and quartiles to gain insights into the central tendency and spread of the data.
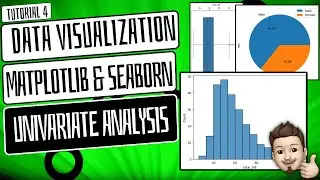
📈 Visualizing Data Distributions:
Visualize the distribution of individual variables using histograms, box plots, and kernel density estimation (KDE) plots. Gain a deeper understanding of the data distribution, outliers, and potential patterns that may emerge.
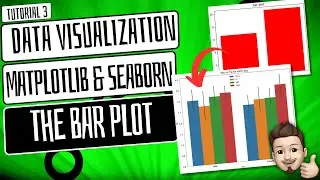
📊 Exploring Categorical Variables:
For categorical variables like gender, smoker status, and day of the week, we'll analyze frequency counts and proportions. Visualize categorical data using bar charts to uncover distribution patterns and potential relationships.
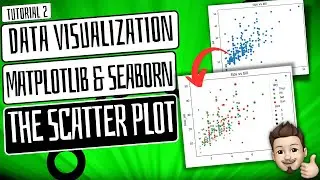
📈 Analyzing Numerical Variables:
For numerical variables like total bill amount and tip amount, we'll explore their distributions and statistical summaries. Use histograms, KDE plots, and box plots to visualize the spread and variability of numerical data.
🔍 Key Insights and Takeaways:
Summarize key findings from the univariate analysis, highlighting interesting trends, outliers, and potential areas for further investigation. Discuss the implications of the findings and their relevance to real-world scenarios.
📊 Hands-On Implementation:
Follow along with Python code examples using Pandas for data manipulation and visualization libraries like Matplotlib and Seaborn for plotting. Gain practical experience in conducting univariate analysis on the "Tips" dataset.
🔔 Stay Tuned for More Insights!
Don't miss out on future tutorials. Hit the notification bell and subscribe to our channel for upcoming videos on data analysis, Python programming, and data visualization. Stay at the forefront of data exploration and insights!
👍 Ready to embark on a journey of univariate analysis with the "Tips" dataset? Give this video a thumbs up, share it with fellow data enthusiasts, and let's uncover hidden trends and patterns together!
#UnivariateAnalysis #DataExploration #DataAnalysis #PythonProgramming #DataVisualization #Pandas #Matplotlib #Seaborn #TipsDataset #StatisticalAnalysis #DataInsights
==========================================================
CHECK OUT OTHER PLAYLISTS:
PYTHON : • PYTHON FROM SCRATCH!!! -PYTHON TUTORI...
SQL : • SQL(Practical Implementations)
STATISTICS : • STATISTICS FOR DATA SCIENCE
NumPy : • Data Preprocessing & Manipulation.