1-minute Charts: Column Chart with Line for Time Series Data in Excel
Fed up with mundane spreadsheets?
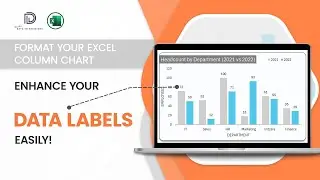
Here’s our Column Chart with Line for Time Series Data chart tutorial in Excel to revolutionize your reports & presentations.
We're here to transform Excel from just a tool into a source of awe. Simply follow the steps in this brief 1-minute video explainer, and craft charts that command attention in your reports! Be it finance, sales, or any time series data, your charts will now narrate stories that captivate everyone.
Full Video here: • How to Create a Column Chart with Lin...
For detailed explanations, check our blog: https://indzara.com/actual-target-cha...
To explore our fast-growing collection of free Excel tutorials covering a wide array of topics, please visit: https://indzara.com/datatodecisions/
#exceltutorials #columncharts #datavisualization #excelskills #excelcharts #spreadsheet #microsoftexcel #datastorytelling #dataanalysis #advancedexcel #exceltips #timeseries #shorts #shortvideo