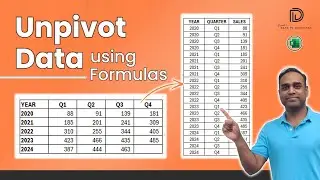
Tornado Charts in Excel: For Only Positive Values Explained!
Unlock the power of Tornado Charts in Excel with our detailed tutorial focusing on scenarios where only positive values are considered.
In this comprehensive video from the #datatodecisions series, we guide you step-by-step through creating a Tornado Chart, also called as a Butterfly chart to visually compare data across different categories.
This chart is perfect where there are two dimensions where one of these dimensions has two possible positive values against a measure, this is your go-to chart!
Check the detailed blog post to create this chart: https://indzara.com/create-tornado-ch...
******************************************************************************
Are you looking for a quick, instant chart-maker template where you can enter just data and have charts readily created for you?
Check our latest product, the Instant Chart Maker from our Data Visualization Toolkit in Excel: https://indzara.com/product/data-visu...
******************************************************************************
Check our Premium Bar Chart Excel Template here:
https://indzara.com/product/data-visu...
Here’s our collection of Visualization templates from Indzara:
https://indzara.com/data-visualizatio...
For more such tutorials, visit https://indzara.com/datatodecisions/
Don't forget to like, subscribe, and hit the notification bell for more Excel tips and tutorials! Leave your questions and comments below, and we’ll be happy to help.
#excelmadeeasy #exceltips #excelchartstutorial #exceltricks #datavisualization #barchart