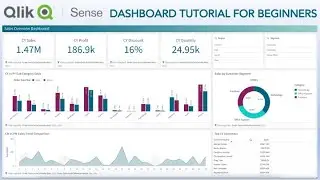
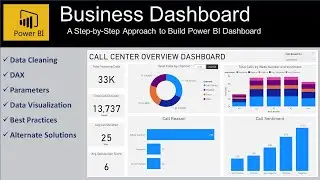
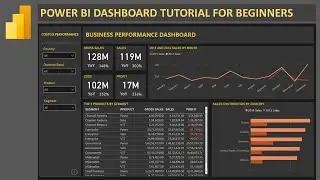
Power BI Call Center Business Performance Advance Dashboard | Learn Power BI By Creating Dashboard
Power BI Advance Dashboard Tutorial for how to create an end to end dashboard within power bi for Call Center to visualize Call Center business related KPIs and visualizations. I am covering a lot of key dashboard design and development techniques in this tutorial so hope you'll enjoy creating this dashboard. Some of the key topics are professional dashboard design, yoy performance metrics, conditional formatting, dax expression for trend comparison and finally a lot of formatting of KPIs, table, line chart, bar chart, slicer and overall dashboard background for a professional look and feel. We’ll create this amazing power bi kpi performance dashboard from scratch with the call center dataset.
Want to take your power bi dashboarding skills to next level? then join my advance power bi dashboard training, email me - [email protected] In this training I cover 10 advance dashboards with lot of dax and visualization configuration for standard and professional looking business dashboards.
RWFD Link - https://data.world/markbradbourne/rwf...
Power BI Tutorials Google Sheet- https://tinyurl.com/4k98sjhh
Many Other Dataset - https://tinyurl.com/yd65vnf3
Time Stamps:
0:00 Call center dashboard overview - KPI, Charts and Functionality
3:36 Power BI tutorial Sheets info
4:15 Dataset overview
6:53 Creating Dashboard from scratch
7:34 CSV Data import
8:01 RWFD Datasets Location and overview
9:10 Data Transformation
11:46 Starting Dashboard Development
14:20 - KPI Creation and Formatting and best practice
17:28 Replicating KPIs and creating their new calculations
24:15 Scenario for alternate business calculations from existing data
27:50 Average CSAT calculation, error identification in data
33:30 Creating new workbook to resolve data issue and replicating measures and KPIs
39:50 Creating vertical and horizontal bar charts
43:46 Creating Parameters
44:40 Creating Pie chart and configuring it with parameter for dynamic behavior
48:00 Creating Week number calculation
49:48 Creating Stack bar chart
54:11 Creating Local to Chart Filter experience by modifying filter
55:12 Handling slicer location to bring it above the chart

![[FREE] SLIMESITO x BEEZYB TYPE BEAT 2022 -](https://images.videosashka.com/watch/1EoTITwenvE)


![Power BI - How to Remove Aggregation Text [Sum of] from Titles and Legend Text](https://images.videosashka.com/watch/k93_ZO0VZus)