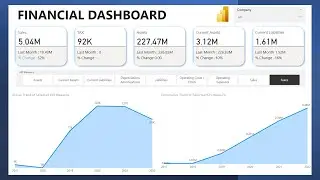
Power BI Dashboard for Finance Data | Build End to End KPI Dashboard for Finance
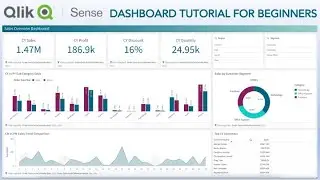
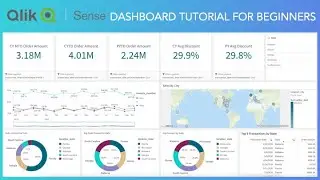
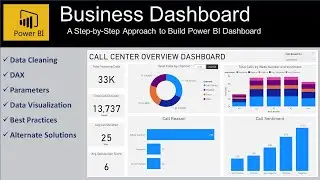
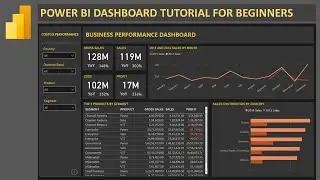
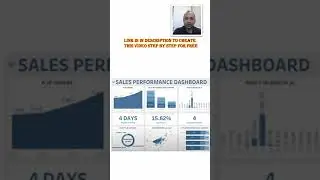
Power BI Tutorial for beginners on how to create an end to end dashboard within power bi for finance business to visualize business related KPIs and visualizations. I am covering a lot of key dashboard design and development techniques in this tutorial so hope you'll enjoy creating this dashboard. Some of the key topics are professional dashboard design, yoy performance metrics, conditional formatting, dax expression for trend comparison and finally a lot of formatting of KPIs, table, line chart, bar chart, slicer and overall dashboard background for a professional look and feel. We’ll create this amazing power bi kpi performance dashboard from scratch with the finance dataset.
Want to take your power bi dashboarding skills to next level? then join my advance power bi dashboard training, email me - [email protected] In this training I cover 10 advance dashboards with lot of dax and visualization configuration for standard and professional looking business dashboards.
Power BI Tutorials Google Sheet- https://tinyurl.com/4k98sjhh
Dataset - https://tinyurl.com/yd65vnf3


![Power BI - How to Remove Aggregation Text [Sum of] from Titles and Legend Text](https://images.videosashka.com/watch/k93_ZO0VZus)