Python Animation - Animated Bar Chart
#techlearners
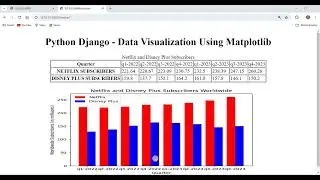
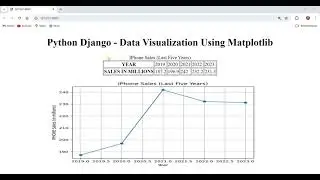
Python Data Visualization using matplotlib
Animated Bar Chart
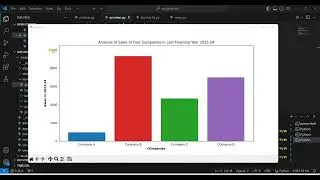
Analysis of Sales of Four Companies in Last Financial Year 2023-24
Prerequisites
1 python setup
2 installed numpy
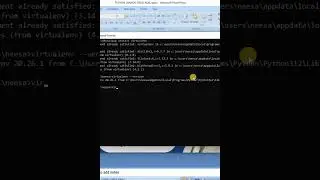
pip install numpy
3 installed matplotlib
pip install matplotlib
Step 1 Create a python file animbar.py
Step 2 import necessary libraries
import numpy as np
from matplotlib import animation, pyplot as plt
Step 3 Create dataset
quarter= ['Company A','Company B','Comapny C','Comapny D']
rng=np.array([10, 100, 50, 75])
data = np.array([20, 20, 20, 20])
Step 4 Create figure
fig, ax = plt.subplots(figsize = (12, 6))
Step 5 Set title and Labels of plot
plt.title("Analysis of Sales of Four Companies in Last Financial Year 2023-24")
ax.set_xlabel('Companies', fontweight ='bold')
ax.set_ylabel('Sales in 2023-24', fontweight ='bold')
Step 6 Create artist for aniimation
artists = []
Step 7 Create color bar
colors = ['tab:blue', 'tab:red', 'tab:green', 'tab:purple']
Step 8 Create loop to update data, set container and append artist
for i in range(100):
data=data+rng
container = ax.bar(quarter, data, color=colors)
artists.append(container)
Step 9 Create animation using artist animation
ani = animation.ArtistAnimation(fig=fig, artists=artists, interval=10, repeat=False)
Step 10 Show plot
plt.show()
TECHLEARNERS BY NEERAJ SAXENA
http://www.techlearners.co.in


![|СОВМЕСТКА| Это любовь в одно касание... [with Ohiko Tyan]](https://images.videosashka.com/watch/inx2Welh5M0)