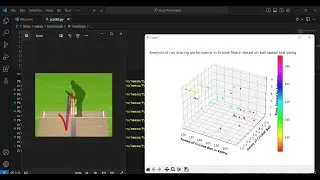
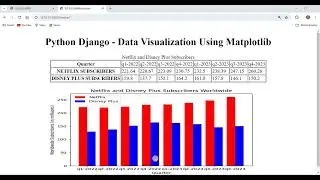
Python Django Data Visualization Matplotlib Bar Chart Netflix and Disney Plus subscribers Worldwide
#techlearners
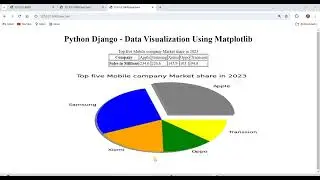
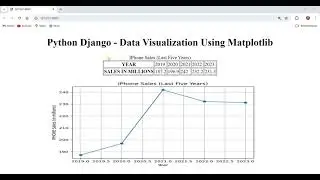
Python Django - Data Visualization using matplotlib
SUbscribers growth of Netflix and Disney Plus in past two years
Prerequisites
1 python django setup
2 python django project
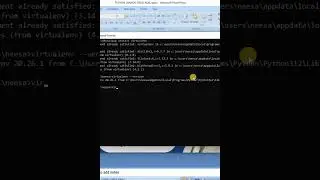
3 installed matplotlib
pip install matplotlib
Step 1 Create a template barchart.html
Step 2 Create a view in views.py for barchart template and to store data
Step 3 Modify template barchart.html to display data in tabular form
step 3 Create url for barchart.html in urls.py
Step 4 Modify barchart view in views.py to create barchart
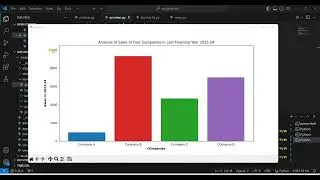
Step 5 DIsplay graph using barchart template file
Step 6 Run server to view chart
python manage.py runserver
TECHLEARNERS BY NEERAJ SAXENA
http://www.techlearners.co.in

![[NRA 2019] NEW Beretta 92X Performance Pistol](https://images.videosashka.com/watch/SpWSjue_8G4)