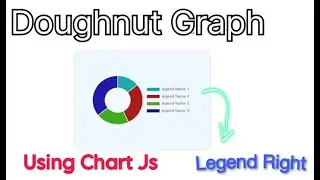
Create and Customise Doughnut Chart in react js .(Part 1)
code : comment me
Description:
📈 Dive into the world of data visualization with this step-by-step tutorial on creating eye-catching Doughnut Charts using Chart.js! 🍩✨ Whether you're a beginner or an experienced developer, follow along as we break down the process of crafting static/dynamic and interactive doughnut graphs.
🔧 In this tutorial, you'll learn:
Setting up Chart.js in your project
Defining data and labels for your doughnut chart
Customizing the appearance with colors, borders, and tooltips
Implementing responsive design for seamless integration on various devices
💻 The power of Chart.js combined with the simplicity of doughnut charts makes for a compelling data representation. Enhance your web applications, dashboards, or reports with visually appealing insights.
🚀 Ready to level up your web development skills? Watch now and unlock the potential of Doughnut Charts with Chart.js! Don't forget to like, subscribe, and hit the notification bell for more coding tutorials! 👩💻👨💻
#ChartJS #DataVisualization #WebDevelopment #DoughnutCharts #CodingTutorial #JavaScript #FrontEndDevelopment #WebDesign #Programming #ChartsAndGraphs #InteractiveCharts #TechTutorial #CodeWithMe #DeveloperCommunity #SubscribeNow #LikeAndShare #WebDevTips #OpenSource #LearnToCode #CodeNerd #ProgrammingLife #TechEducation #CodingJourney #WebDev101 #DeveloperResources #react #reacts #graph #chart #chartjs #custom #customgraphics #arc #border #borderradiou #radius


![Take value form user make a table using React.js || Object store in Array || [ {...} ]](https://images.videosashka.com/watch/tkDym1sohI4)

