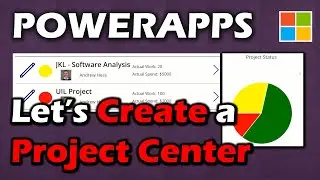
Creating Charts in Power Apps for Project Management
In this video we create 2 charts, 1 to compare High,Med,Low with Risk in a project and another to compare Actual Cost Vs. Planned Cost.
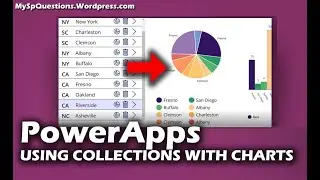
One of these charts is a pie chart and we separate the data into 3 charts and then do a UNION and combine the data back together to avoid a delegation issue. The other is a Line chart and we use this chart to compare actual cost and planned cost to notice when we spend more than planned cost on a project.
Hope you enjoy these videos and design your own charts using some of the skills learned here today.
Thanks for watching!
Previous Videos Related to this PowerApp:
Part 5: Autonumber and Custom Form: • Creating A Completely Custom Form in ...
Part 4: Changing Order of Gallery: • Editable Task List with Progress Bar ...
Part 3: Creating Project Center: • Let's Create a Project Dashboard in P...
Part 2: Defaulting Content Types: • Power Apps with Content Types and set...
Part 1: Content Types: • Creating 2 Forms with 1 List in Share...
Formula for OnVisible Property:
Concurrent(Clear(colRedRisk),Clear(colYellowRisk),Clear(colGreenRisk));
Concurrent(
ForAll(Filter(ProjectTasksList,ProjectID=galProjects.Selected.ID,Risk="High"),Collect(colRedRisk,{RTitle:"Red",Risk:Risk})),
ForAll(Filter(ProjectTasksList,ProjectID=galProjects.Selected.ID,Risk="Medium"),Collect(colYellowRisk,{RTitle:"Yellow",Risk:Risk})),
ForAll(Filter(ProjectTasksList,ProjectID=galProjects.Selected.ID,Risk="Low"),Collect(colGreenRisk,{RTitle:"Green",Risk:Risk})));
ClearCollect(colTaskRisk,CountRows(colRedRisk),CountRows(colYellowRisk),CountRows(colGreenRisk));
////////////////////////////////////////////////////////////////////////////////////////////////////////////
Clear(colActualCost);
ForAll(Filter(ProjectTasksList,ProjectID=galProjects.Selected.ID,TaskStatus="Complete"),Collect(colActualCost,{Title:Title,ActualCost:Actual_x0020_Cost,Cost:Budget}));
Chapters
0:00 Introduction
2:57 Introduction on Charts
4:40 Why do people use Line Charts?
5:50 Why do people use Pie Charts?
6:30 Writing Collection Statements for Pie Chart
7:05 Concurrent ForAll Filter
10:16 Concurrent Clear Collections
10:47 ClearCollect to Join the Collections in a Union
12:16 Change the ColorSet
14:05 Create a Line Chart
16:00 For All Collect Actual Cost and Planned Cost
17:30 Increate Number of series
18:47 Only Show When Task is Complete
20:00 Testing a New Task
21:50 Discussing Impact and Probability in a Risk
23:04 Conclusion