How to Create an Interactive Line Chart with Dynamic X-Axis?
In this installment of the #DatatoDecisions series, we’ll create a dynamic line #chart with #interactive horizontal axis.
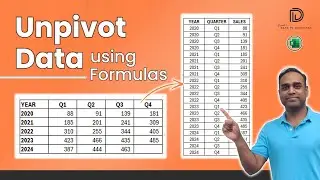
Consider a dataset with sales data over a period of time. For analysis, one might need to be able to view both, monthly as well as quarterly trends over time.
In such cases, a line chart dynamic X-axis comes in handy!
0:42 Create labels for the dynamic horizontal axis
5:13 Create columns for the X and Y axes for the chart (the chart data)
7:18 Create named ranges for the chart data
8:16 Create the line chart
10:41 Format the chart
By the end of this video, you should be able to create this chart with ease, instantly.
Here's our collection of Visualization templates from Indzara:
https://indzara.com/data-visualizatio...
Our detailed blog post on the video:
https://indzara.com/line-chart-with-d...
For more such tutorials, visit https://indzara.com/datatodecisions/
#excelmadeeasy #excelcharts #exceltutorials #DatatoDecisions #visualization #excelvisualization