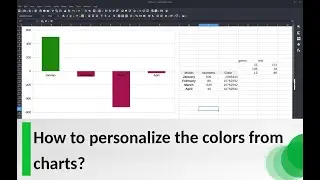
How to personalize the colors from charts? LibreOffice Calc
I forget to mention that in order for chart to SEE the colors from that column, you have to do one more step:
Double-click the chart - right click and choose Data Ranges - choose the tab Data series - click on Fill color and for Range for fill color choose the column with colors from the video. This step was done for me at the moment of the recordings.
The video was recorded using version
Version: 7.5.1.1 (X86_64) / LibreOffice Community
Build ID: bd819218336a5be54a11b986ea4dd2db2efb120e
CPU threads: 16; OS: Linux 5.19; UI render: default; VCL: gtk3
Calc: threaded
Please see those playlists for more videos:
LibreOffice Writer
• LibreOffice Writer
LibreOffice Calc
• LibreOffice Calc
Testing LibreOffice
• Testing LibreOffice
LibreOffice - general things
• LIbreOffice
Twitter:
/ libreoffices
The official website:
LibreOffice is free do download for Linux, Windows and Mac.
https://www.libreoffice.org/download/...
What can YOU do for LibreOffice:
https://whatcanidoforlibreoffice.org/...
Documentation for LibreOffice:
https://documentation.libreoffice.org...
Professional Suport for using LibreOffice:
Collabora Productivity
https://www.collaboraoffice.com/code/
CIB software GmbH
https://libreoffice.cib.de/
Adfinis AG
https://adfinis.com/en/


