How to Create Progress Bar in Spreadsheet
Welcome back to our channel! In this video, we'll show you how to create stunning, dynamic visual summaries using the SPARKLINE function with COUNTIF in Google Sheets. Whether you're a data enthusiast, project manager, or just love keeping your spreadsheets organized, this tutorial is for you!
📋 What You'll Learn:
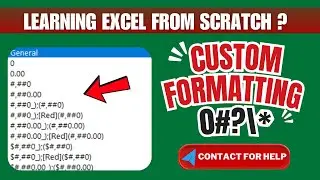
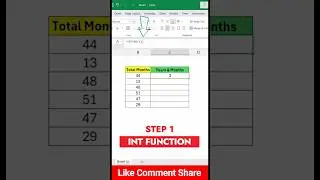
Formula Breakdown: Understand each component of =SPARKLINE(COUNTIF(D4:F4,true),{"charttype","bar";"max",3;"color1","Green"}).
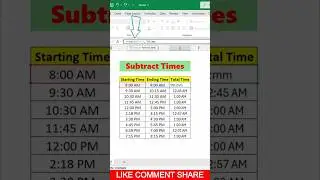
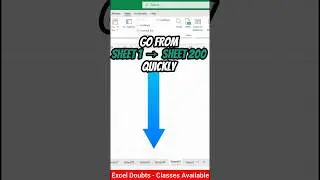
Step-by-Step Demonstration: Watch as we set up a sample spreadsheet and apply the formula to visualize data effortlessly.
Customization Tips: Discover how to customize your sparklines with different chart types, maximum values, and colors.
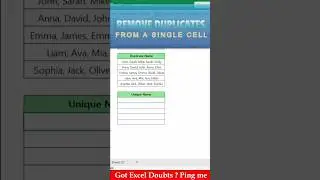
Real-World Use Cases: Learn practical applications for task tracking, survey results, attendance records, and more.
🔥 Why Watch?
Enhance Data Comprehension: Transform raw data into easy-to-read visual summaries.
Professional Touch: Add a sleek, professional look to your reports and dashboards.
Simple & Effective: Easy to implement and customize for various needs.
📌 Don't Miss Out:
Subscribe for more Google Sheets tips and tricks!
Like & Share this video if you found it helpful.
Comment below with any questions or suggestions for future videos!
Join us and take your Google Sheets skills to the next level. Happy spreadsheeting! 🧮✨
Follow Us:
📸 Instagram: @Excelonlineadvisor
Related Videos:
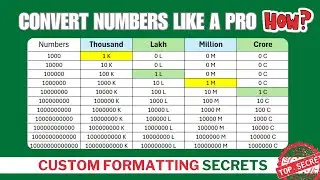
▶️ How to convert Number into Lakh - Excel Tricks & Tips ( • How to convert Number into Lakh - Exc... )
▶️ Send Email From Excel along with Data | Automate Your Daily Report |( • Send Email From Excel along with Data... )
#GoogleSheets #DataVisualization #SPARKLINE #SpreadsheetTips #DataAnalysis #productivityhacks


![COLLAPSE [Doom] 13000 MMR Offlane Show His Signature Hero Dota 2](https://images.videosashka.com/watch/cEa3yB8XfvQ)


![[You Can't Get] Love From A Stone](https://images.videosashka.com/watch/j7jTbhXGbxs)