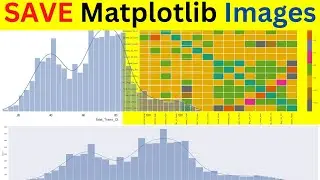
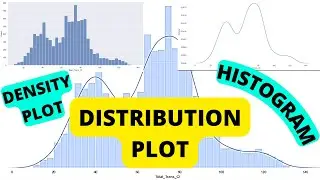
How to Create Distribution/Histogram Plot using Seaborn , Matplotlib, and Python
How to create KDE Histogram Distribution Plot. How to create 'HIST' Histogram distribution plot. How to SuperImpose and COMBINE 'HIST' and 'KDE' distribution Plot
Seaborn Distribution Plot Documentation - https://seaborn.pydata.org/generated/...
Timestamps:
00:00 Introduction
00:20 Data Prep
02:02 Create histogram using Seaborn
03:59 Change the Size, Height, Width, Aspect ratio of Seaborn Distribution / Histogram map.
04:29 Kind = "Hist". Default Distribution Type
05:19 Kind = "Kde". Default Distribution Type
05:50 Combine KDE plot and HIST plot into a single Graph
09:42 Get access to this notebook and other notebooks
Get This Notebook and Other notebooks, python files, csv files, plus other FREE Resources - https://evidencenmedia.com/free
Follow me on twitter -- / evidencenmedia
Follow me on Linkedin -- / evidencen
Follow me on Github -- https://github.com/EvidenceN
My Blog -- https://evidencen.com/blog/
Support this Channel -- / @techengineerschool
Support my work directly -- https://evidencenmedia.com/support-Ev...
Email/Contact me -- https://evidencen.com/contact-me/


![[SOLVED] WARNING Unprotected Private RSA Pem Key File Ansible EC2 Windows Ubuntu Debian](https://images.videosashka.com/watch/CLaz2DmXtuI)