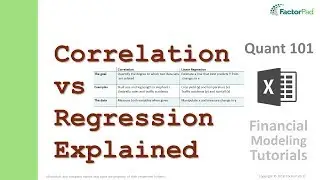
How to interpret Correlation and R-Squared | Financial Modeling Tutorials
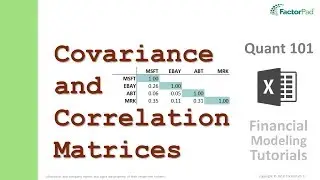
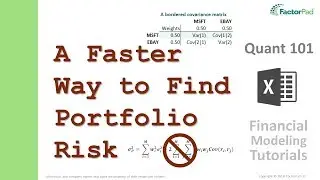
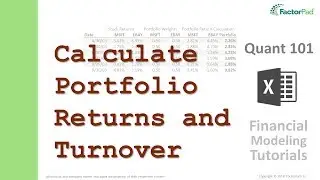
A financial modeling tutorial on interpreting correlation analysis in Excel with R-Squared for investments and issues that arise like outliers, curvilinear relationships, non-normal distributions, hidden variables and spurious correlations for better data analysis.
For the video transcript and Excel formulas see:
https://factorpad.com/fin/quant-101/i...
To zoom straight to each section use this:
00:55 - Video Outline
01:25 - Step 1 - Summarize Correlation
07:42 - Step 2 - The Interpretation of Correlation
09:13 - Step 3 - R-Squared (Coefficient of Determination)
10:44 - Step 4 - Frequent Issues with Correlation
14:02 - Video Summary
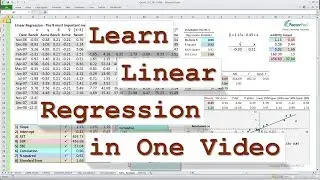
14:35 - Step 5 - Next: Linear Regression
14:52 - It's May, time for horse races and the NBA Playoffs
For the outline to the Playlist see:
https://factorpad.com/fin/quant-101/q...
See what else there is to learn at:
https://factorpad.com
Happy Learning!