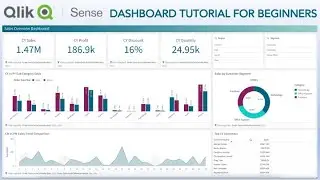
33 How to Create Simple Table in Qlik Sense and Changing its Properties
In this #qliksense tutorial video I have talked about how you can create simple table chart in qliksense and change its properties.
#QlikSenseTutorial
Table
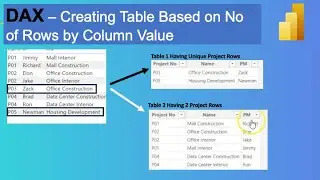
The table shows several fields simultaneously, where the content of each row is logically connected. Typically, a table consists of one dimension and several measures.
When to use it
Use a table, when you want to view detailed data and precise values rather than visualizations of values. Tables are good when you want to compare individual values. Drill-down group dimensions are very efficient in tables. Within a limited space, you can drill down to the next level of detail and analyze the updated measure values.
Advantages
You can filter and sort the table in different ways. Many values can be included in a table, and when you drill down in a table, you make good use of a limited space of the sheet. A table is excellent when you want to see exact values rather than trends or patterns.
Disadvantages
If the table contains many values, it is difficult to get an overview of how values are related. It is also hard to identify an irregularity within the table.
Creating a table
You can create a new table on the sheet you are editing.
Do the following:
From the assets panel, drag an empty table to the sheet.
Click Add dimension and select a dimension or a field.
Click Add measure and select a measure or create a measure from a field.
When you have created the table, you may want to adjust its appearance and other settings in the properties panel.
Tip: Column width is automatically set to keep columns together for improved readability. You can adjust the width of a column by dragging the header divider. Double-click the header divider to reset to the default width.
Aligning data
If Text alignment is set to Auto, column data is aligned according to data type: text values are left-aligned and number values, including date related values, are right-aligned. If you set it to Custom, you can select to align the data to the left or to the right.
Sorting the table
You can adjust the sorting of the table in several ways:
Column sorting - adjust the order of the dimensions and measures from left to right
Row sorting - adjust the sorting priority order of the rows
Internal sorting - use the internal sorting order of dimensions and measures
Interactive sorting - during analysis you can click on a column header to sort the table
Column sorting
By default, the order in which columns are sorted is set by the order in which dimensions and measures are added to the table. If you add the measure Sales first, it is presented first (leftmost) in the table. The next dimension or measure that is added is presented in the second column, and so on. The column sorting order can be changed in the properties panel, under Columns.
Row sorting
By default, rows are sorted by the first added dimension or measure, numeric values descending, text values ascending. A small arrow under the column header shows by which column the table is sorted.
You can change the row sorting in the properties panel, under Sorting. Drag the dimensions and measures to change the sorting priority order. In many cases, sorting is not only affected by the first dimension or measure in Sorting, but also the following ones.
Internal sorting
Each dimension and measure has a default (Auto) internal sorting order, which can be changed. Under Sorting, click the item you want to change and click the button to switch to Custom sorting. Changes made to the internal sorting of an item may not have any effect if the sorting is in conflict with an item with higher priority.
Interactive sorting
During analysis, you can set which column to sort on by clicking the column header. The first click sorts the table according to the default sorting of the selected item. A second click reverses the sorting order. Interactive sorting is session based and is not saved. If you want your changes to the sorting to be persistent, you need to make the changes in the properties panel.
Displaying totals
By default, the totals of numeric values are displayed under the column names. In the properties panel, you can change this to display the totals at the bottom of a column, or not at all.
Displaying more data
You can freeze the first column from scrolling, and select to wrap multiline text in headers and cells separately. These settings are changed in the property panel under Appearance - Presentation.
Display limitations
Number of rows and columns
In a table, you can have millions of rows and virtually any number of columns with dimensions and measures. But because huge tables are impractical and hard to manage, the limit for what is practical is far less than the theoretical maximum. In most cases, it is desirable to see all the columns without scrolling horizontally.
Tables with content of mixed sizes
In a table you can have both columns where the content fits on one


![Power BI - How to Remove Aggregation Text [Sum of] from Titles and Legend Text](https://images.videosashka.com/watch/k93_ZO0VZus)